More than one million, that’s the number of active Grafana installations worldwide. In the realm of data visualization and monitoring, Grafana has emerged as a go-to solution for organizations and individuals alike. With its powerful features and intuitive interface, Grafana enables users to gain valuable insights from their data.
Picture this scenario: You have a locally hosted web application that you need to test thoroughly, but accessing it remotely for testing purposes seems like an insurmountable task. This is where the Grafana Cloud Docker Extension comes to the rescue. This extension offers a seamless solution to the problem by establishing a secure connection between your local environment and the Grafana Cloud platform.
In this article, we’ll explore the benefits of using the Grafana Cloud Docker Extension and describe how it can bridge the gap between your local machine and the remote Grafana Cloud platform.

Overview of Grafana Cloud
Grafana Cloud is a fully managed, cloud-hosted observability platform ideal for cloud-native environments. With its robust features, wide user adoption, and comprehensive documentation, Grafana Cloud is a leading observability platform that empowers organizations to gain insights, make data-driven decisions, and ensure the reliability and performance of their applications and infrastructure.
Grafana Cloud is an open, composable observability stack that supports various popular data sources, such as Prometheus, Elasticsearch, Amazon CloudWatch, and more (Figure 1). By configuring these data sources, users can create custom dashboards, set up alerts, and visualize their data in real-time. The platform also offers performance and load testing with Grafana Cloud k6 and incident response and management with Grafana Incident and Grafana OnCall to enhance the observability experience.

Why run Grafana Cloud as a Docker Extension?
The Grafana Cloud Docker Extension is your gateway to seamless testing and monitoring, empowering you to make informed decisions based on accurate data and insights. The Docker Desktop integration in Grafana Cloud brings seamless monitoring capabilities to your local development environment.
Docker Desktop, a user-friendly application for Mac, Windows, and Linux, enables you to containerize your applications and services effortlessly. With the Grafana Cloud extension integrated into Docker Desktop, you can now monitor your local Docker Desktop instance and gain valuable insights.
The following quick-start video shows how to monitor your local Docker Desktop instance using the Grafana Cloud Extension in Docker Desktop:
The Docker Desktop integration in Grafana Cloud provides a set of prebuilt Grafana dashboards specifically designed for monitoring Docker metrics and logs. These dashboards offer visual representations of essential Docker-related metrics, allowing you to track container resource usage, network activity, and overall performance. Additionally, the integration also includes monitoring for Linux host metrics and logs, providing a comprehensive view of your development environment.
Using the Grafana Cloud extension, you can visualize and analyze the metrics and logs generated by your Docker Desktop instance. This enables you to identify potential issues, optimize resource allocation, and ensure the smooth operation of your containerized applications and microservices.
Getting started
Prerequisites: Docker Desktop 4.8 or later and a Grafana Cloud account.
Note: You must ensure that the Docker Extension is enabled (Figure 2).

Step 1. Install the Grafana Cloud Docker Extension
In the Extensions Marketplace, search for Grafana and select Install (Figure 3).

Step 2. Create your Grafana Cloud account
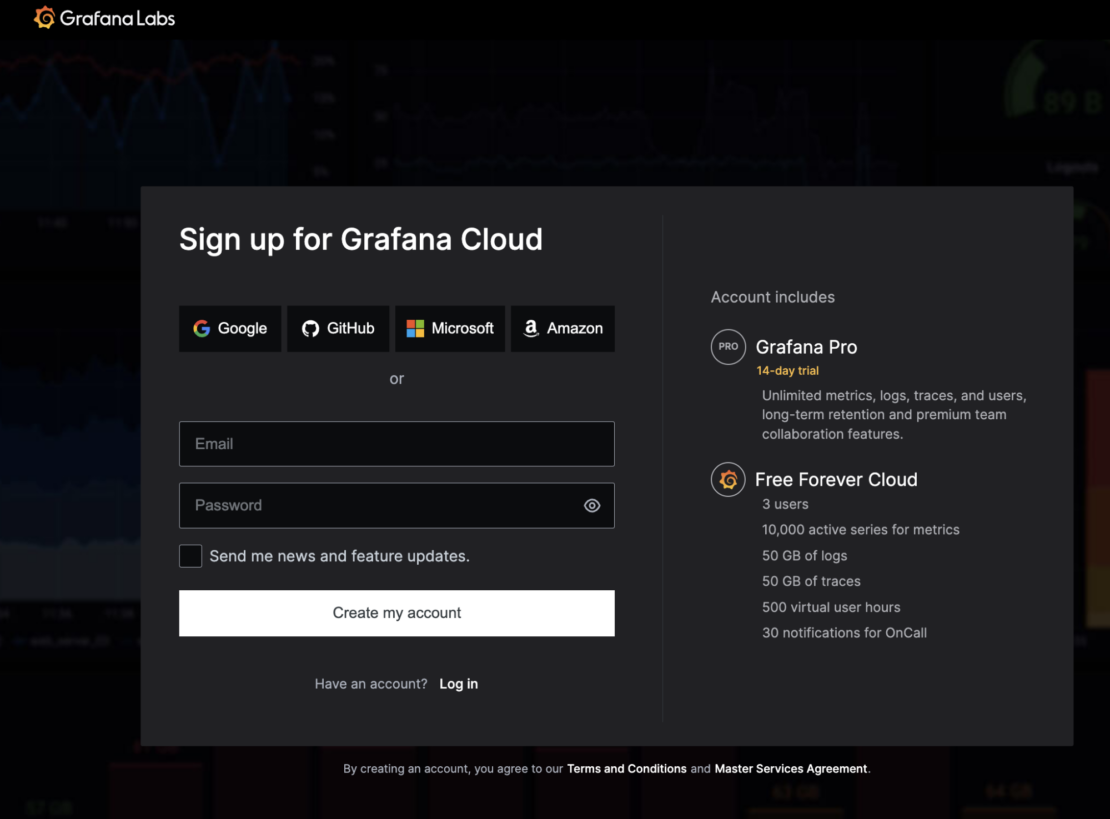
A Grafana Cloud account is required to use the Docker Desktop integration. If you don’t have a Grafana Cloud account, you can sign up for a free account today (Figure 4).

Step 3. Find the Connections console
In your Grafana instance on Grafana Cloud, use the left-hand navigation bar to find the Connections Console (Home > Connections > Connect data) as shown in Figure 5.

Step 4. Install the Docker Desktop integration
To start sending metrics and logs to the Grafana Cloud, install the Docker Desktop integration (Figure 6). This integration lets you fetch the values of connection variables required to connect to your account.

Step 5. Connect your Docker Desktop instance to Grafana Cloud
It’s time to open and connect the Docker Desktop extension to the Grafana Cloud (Figure 7). Enter the connection variable you found while installing the Docker Desktop integration on Grafana Cloud.

Step 6. Check if Grafana Cloud is receiving data from Docker Desktop
Test the connection to ensure that the agent is collecting data (Figure 8).

Step 7. View the Grafana dashboard
The Grafana dashboard shows the integration with Docker Desktop (Figure 9).

Step 8. Start monitoring your Docker Desktop instance
After the integration is installed, the Docker Desktop extension will start sending metrics and logs to Grafana Cloud.
You will see three prebuilt dashboards installed in Grafana Cloud for Docker Desktop.
Docker Overview dashboard
This Grafana dashboard gives a general overview of the Docker Desktop instance based on the metrics exposed by the cadvisor Prometheus exporter (Figure 10).

The key metrics monitored are:
- Number of containers/images
- CPU metrics
- Memory metrics
- Network metrics
This dashboard also contains a shortcut at the top for the logs dashboard so you can correlate logs and metrics for troubleshooting.
Docker Logs dashboard
This Grafana dashboard provides logs and metrics related to logs of the running Docker containers on the Docker Desktop engine (Figure 11).

Logs and metrics can be filtered based on the Docker Desktop instance and the container using the drop-down for template variables on the top of the dashboard.
Docker Desktop Node Exporter/Nodes dashboard
This Grafana dashboard provides the metrics of the Linux virtual machine used to host the Docker engine for Docker Desktop (Figure 12).

How to monitor Redis in a Docker container with Grafana Cloud
Because the Grafana Agent is embedded inside the Grafana Cloud extension for Docker Desktop, it can easily be configured to monitor other systems running on Docker Desktop that are supported by the Grafana Agent.
For example, we can monitor a Redis instance running inside a container in Docker Desktop using the Redis integration for Grafana Cloud and the Docker Desktop extension.
If we have a Redis database running inside our Docker Desktop instance, we can install the Redis integration on Grafana Cloud by navigating to the Connections Console (Home > Connections > Connect data) and clicking on the Redis tile (Figure 13).

To start collecting metrics from the Redis server, we can copy the corresponding agent snippet into our agent configuration in the Docker Desktop extension. Click on Configuration in the Docker Desktop extension and add the following snippet under the integrations key. Then press Save configuration (Figure 14).

integrations:
  redis_exporter:
    enabled: true
    redis_addr: 'localhost:6379'
In its default settings, the Grafana agent container is not connected to the default bridge network of Docker desktop. To connect the agent to this container, run the following command:
docker network connect bridge grafana-docker-desktop-extension-agent
This step allows the agent to connect and scrape metrics from applications running on other containers. Now you can see Redis metrics on the dashboard installed as part of the Redis solution for Grafana Cloud (Figure 15).

Conclusion
With the Docker Desktop integration in Grafana Cloud and its prebuilt Grafana dashboards, monitoring your Docker Desktop environment becomes a streamlined process. The Grafana Cloud Docker Extension allows you to gain valuable insights into your local Docker instance, make data-driven decisions, and optimize your development workflow with the power of Grafana Cloud. Explore a new realm of testing possibilities and elevate your monitoring game to new heights.
Check out the Grafana Cloud Docker Extension on Docker Hub.
from Docker https://bit.ly/3qvHS73
via IFTTT
No comments:
Post a Comment