INTRODUCTION
While some OS-s built on Linux kernel support NVMe-oF, Windows just does not. No worries, there are some ways to bring this protocol to a Windows environment! In this article, I investigate whether presenting an NVMe drive over RDMA with Linux SPDK NVMe-oF Target + Chelsio NVMe-oF Initiator provides you the perfomance that vendors of flash list in their datasheets.

It is really interesting for me to see if there is a way to present an NVMe drive over the network in a Windows environment as effectively as it can be done on Linux (https://www.starwindsoftware.com/blog/hyper-v/nvme-part-1-linux-nvme-initiator-linux-spdk-nvmf-target/). For now, there are only two NVMe-oF initiators for Windows (if you know any, please share the info in comments). In this post, I take a closer look at one developed by Chelsio. My next article sheds light on an initiator created by StarWind.
THE TOOLKIT USED
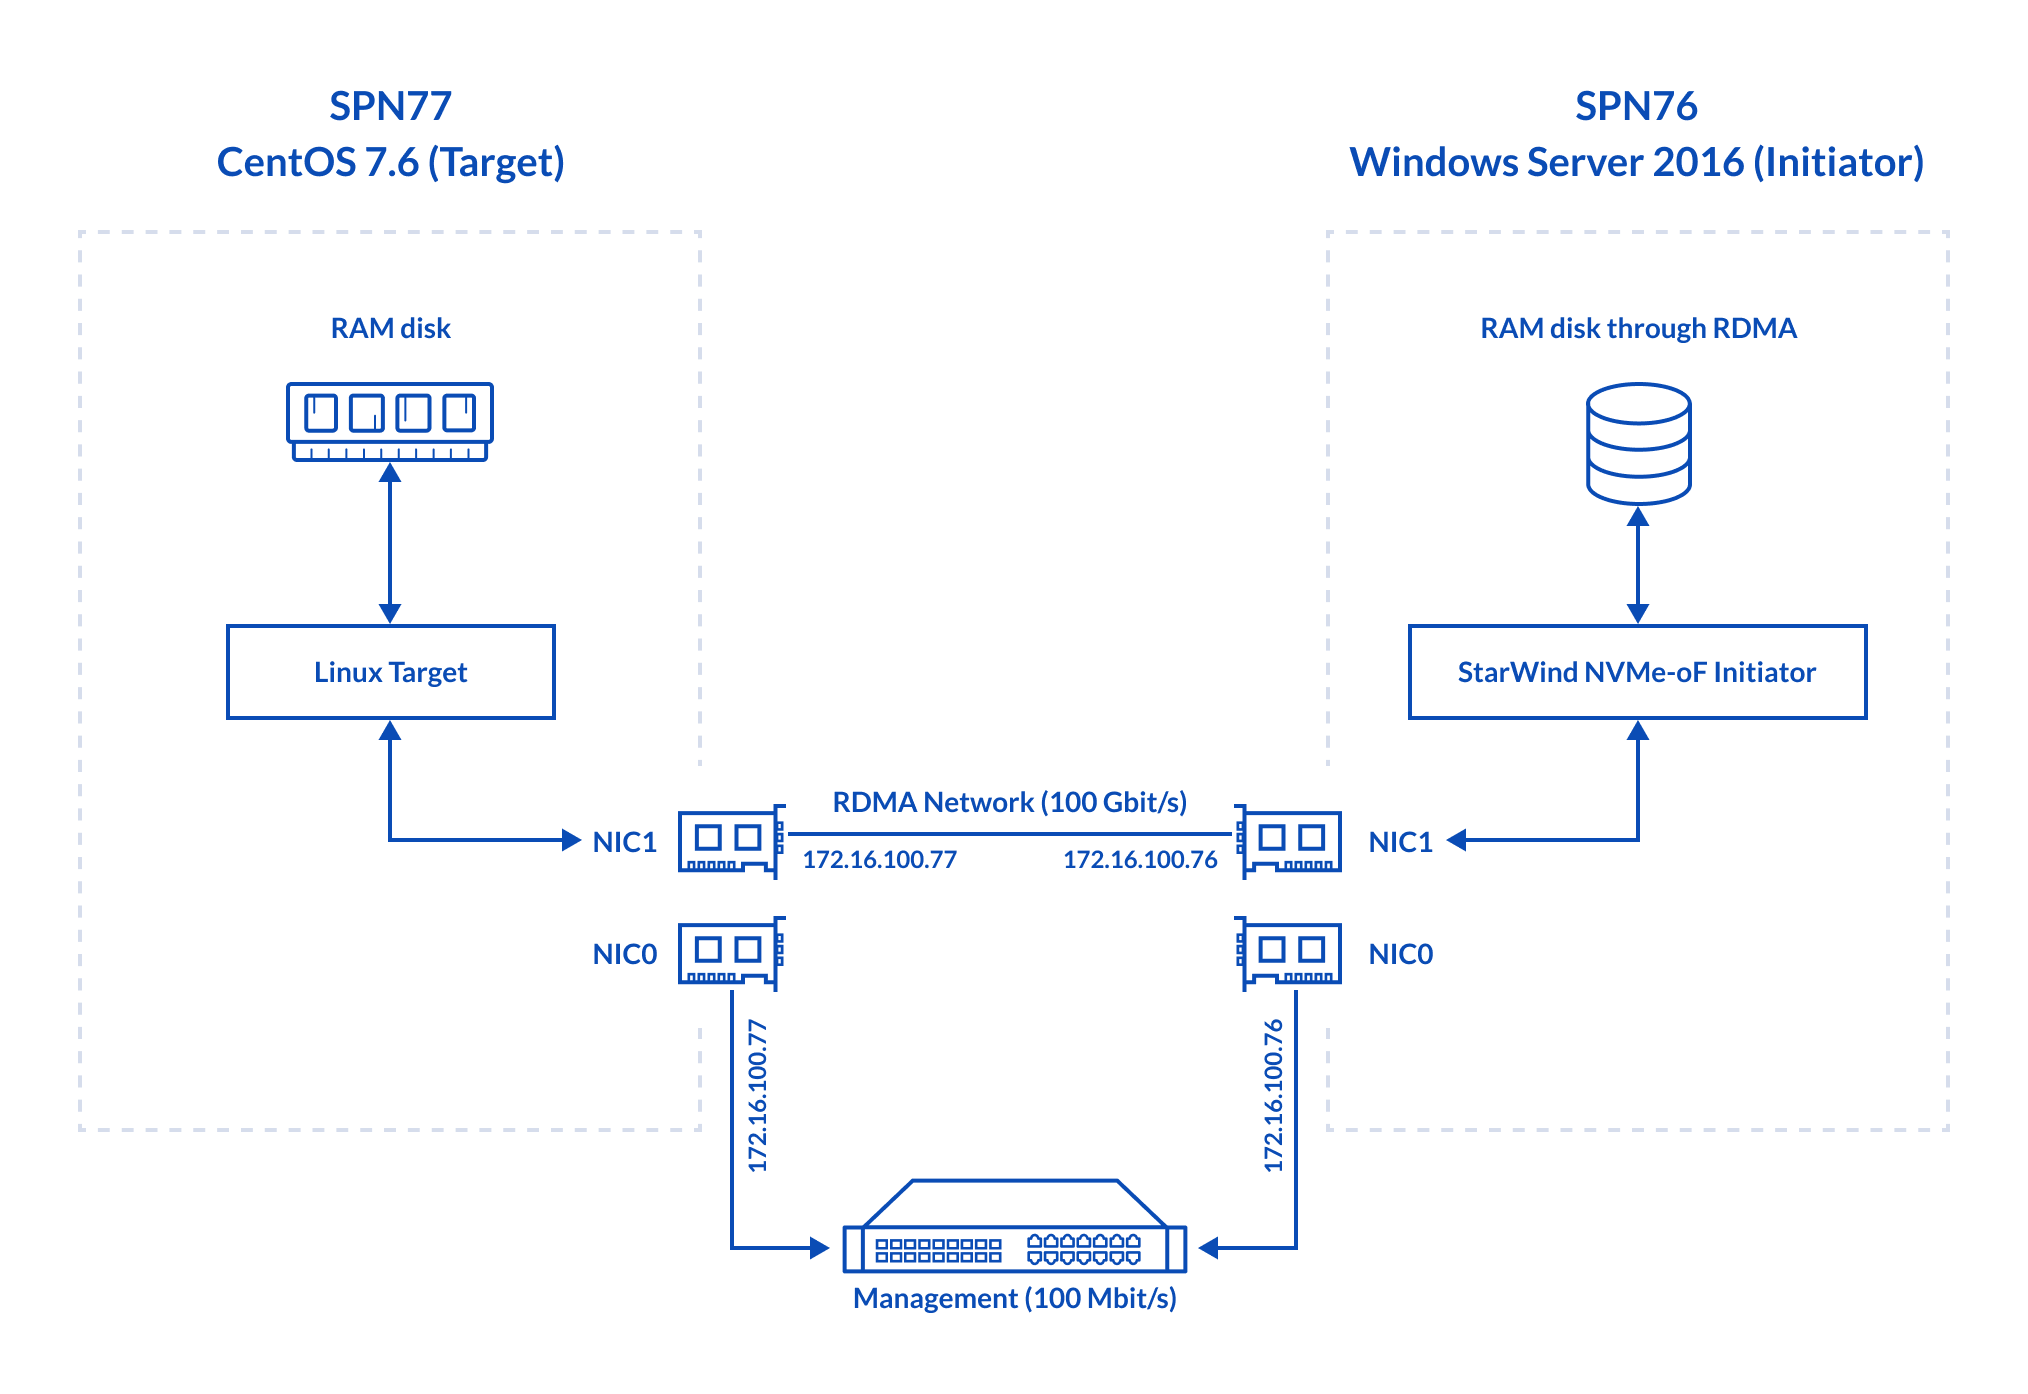
Linux SPDK RAM disk NVMe-oF Target ↔ Chelsio NVMe-oF Initiator for Windows
Linux SPDK Intel Optane 900P NVMe-oF Target ↔ Chelsio NVMe-oF Initiator for Windows
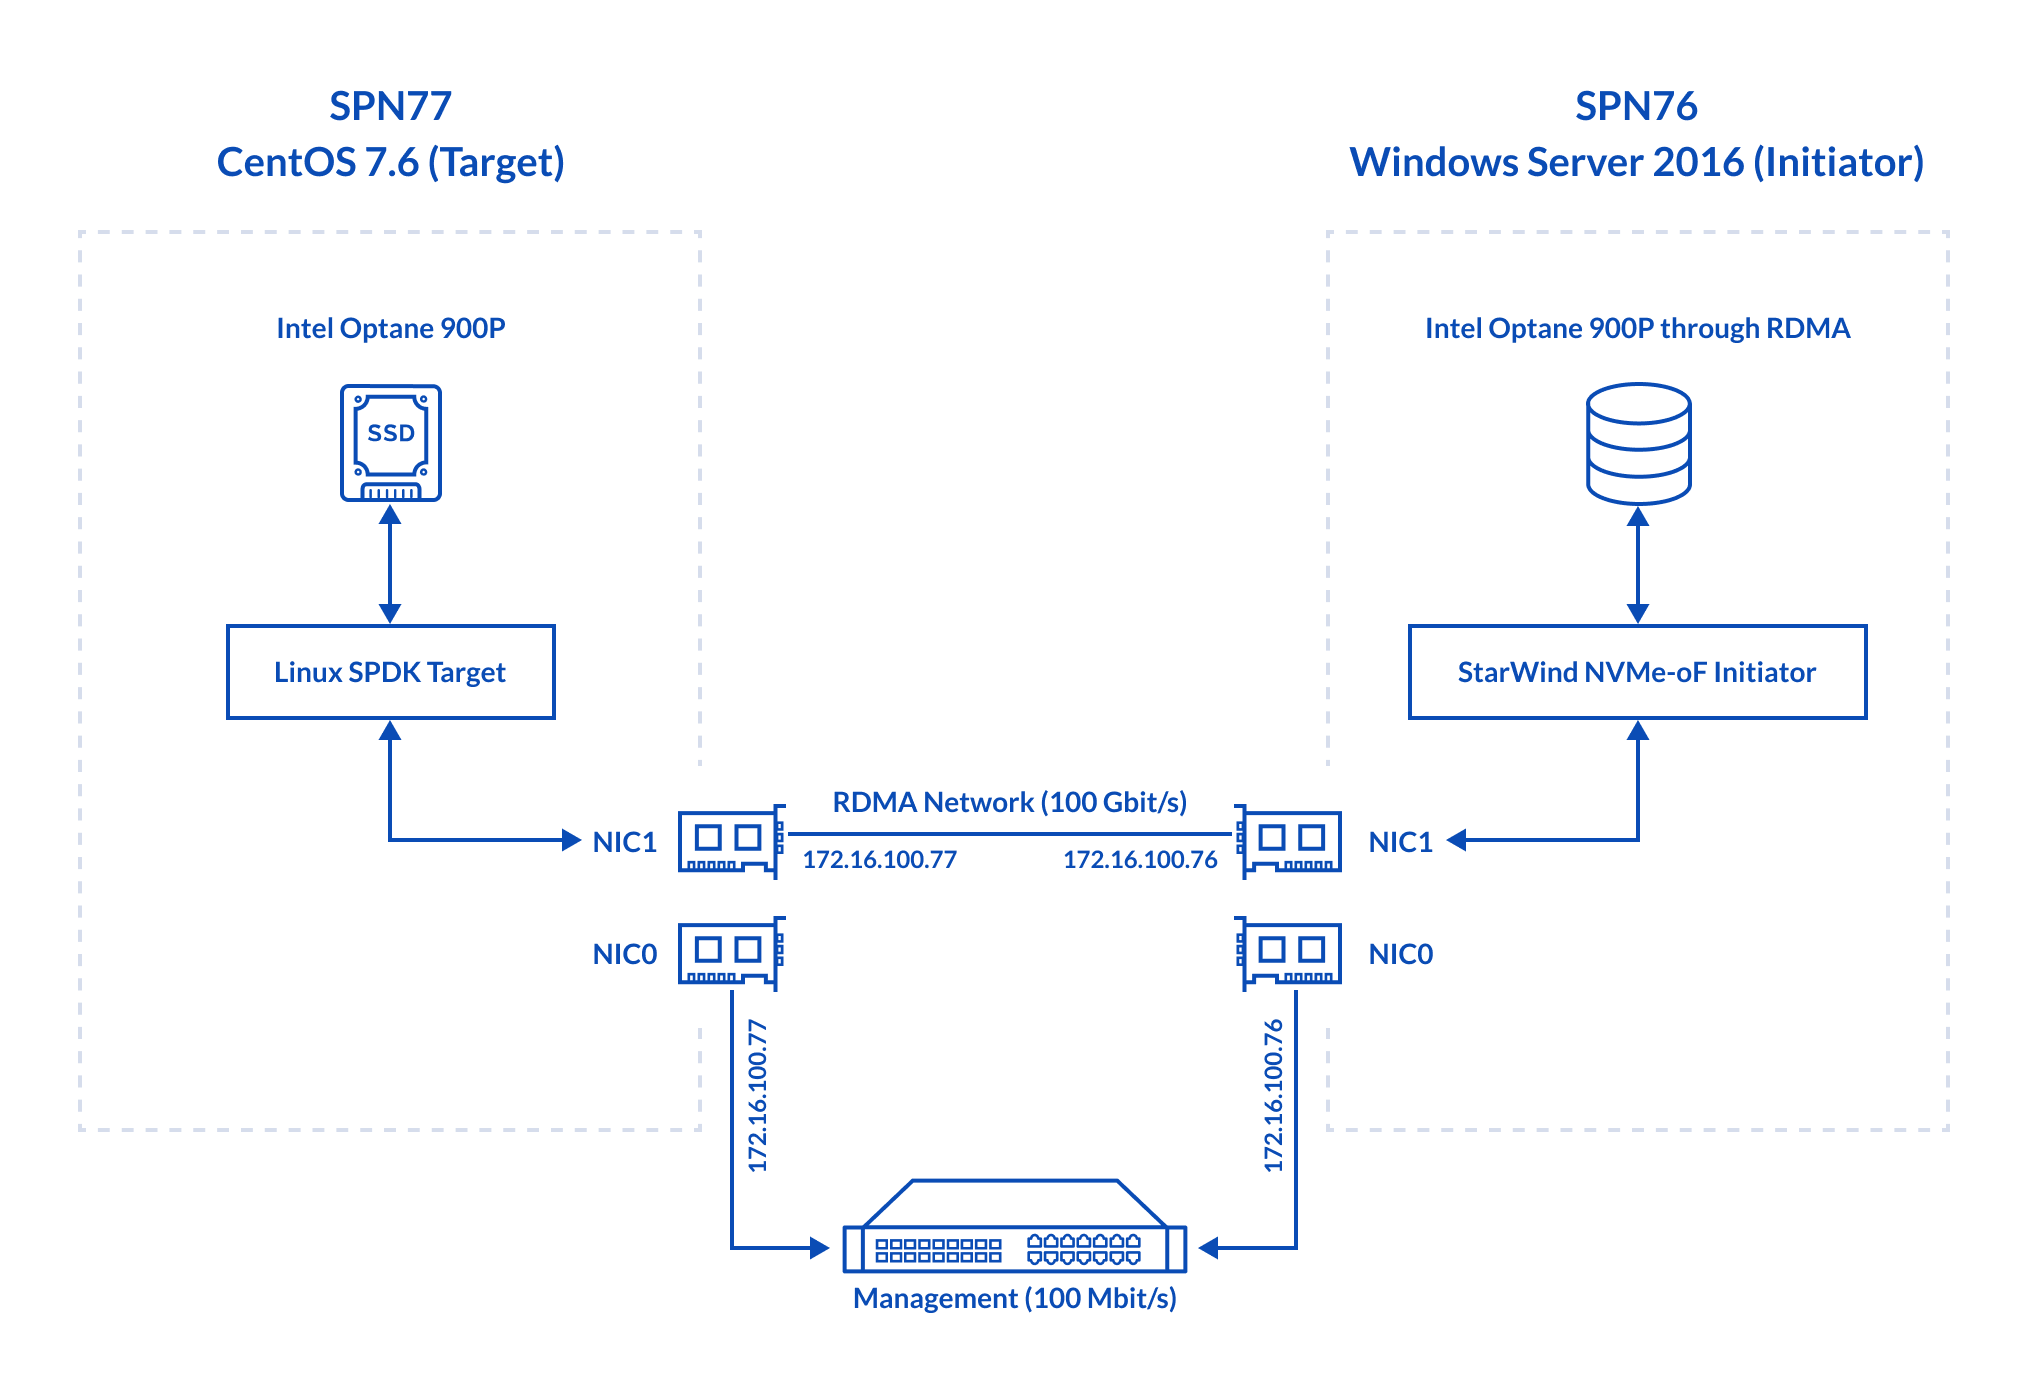
Here’s some more info about the setup configuration. Let’s discuss the hardware configuration of the Target host, SPN77.
- Dell PowerEdge R730, CPU 2x Intel Xeon E5-2683 v3 @ 2.00GHz, RAM 128 GB
- Network – Chelsio T62100 LP-CR 100 Gbps
- Storage – Intel Optane 900P
- OS – CentOS 7.6 (Kernel 4.19.34) (Target)
Now, take a look at the hardware configuration of the Initiator host, SPN76.
- Dell PowerEdge R730, CPU 2x Intel Xeon E5-2683 v3 @ 2.00GHz, RAM 128 GB
- Network – Chelsio T62100 LP-CR 100 Gbps
- OS – Windows Server 2016
On the Initiator side, I have Chelsio NVMe Initiator Tool installed. Linux SPDK NVMe-oF Target is running on the Target host.
TESTING NETWORK THROUGHPUT
In this article, network throughput was measured with iPerf (TCP) and rPerf (RDMA).
Before starting the tests, install Chelsio T62100 LP-CR for CentOS 7.6 with this command:
yum install -y libnl-devel libnl3-devel valgrind-devel rdma-core-devel
Chelsio recommends unloading inbox driver before installing OFED drivers. Here’s the command to do that:
rmmod csiostor cxgb4i cxgbit iw_cxgb4 chcr cxgb4vf cxgb4 libcxgbi libcxgb
Next, you need to download the driver archive from the source and install it.
wget https://service.chelsio.com/store2/T5/Unified%20Wire/Linux/ChelsioUwire-3.11.0.0/ChelsioUwire-3.11.0.0.tar.gz

tar -xvzf ChelsioUwire-3.11.0.0/ChelsioUwire-3.11.0.0.tar.gz

cd ChelsioUwire-3.11.0.0

make nvme_install
Start OFED afterward. Note that you need to run them as a root user!
modprobe iw_cxgb4

modprobe rdma_ucm
First, I checked whether NIC-s allow for RDMA traffic. For this purpose, I used rperf and rping utilities that are supplied with rPerf. rperf allows measuring the network throughput, while rping is a qualitative tool to see whether hosts can talk over RDMA at all. In rPerf for Windows, these utilities are called rd_rperf and nd_rping respectively. Both utilities are to be installed on the Target and Initiator hosts.
On the Initiator side (SPN76), I started the utility in the “server” mode (i.e., I used the –s flag with host IP):
nd_rping -s -a 172.16.100.76 –v
On the Target side (SPN77), the utility was started as a “client” (i.e., with the –c flag in front of host IP).
rping -c -a 172.16.100.77 -v
With settings like that, SPN77 will talk with SPN76 over RDMA. It may seem that I have set the flags wrong, rping, however, does not care that much about that. You can set roles other way around.
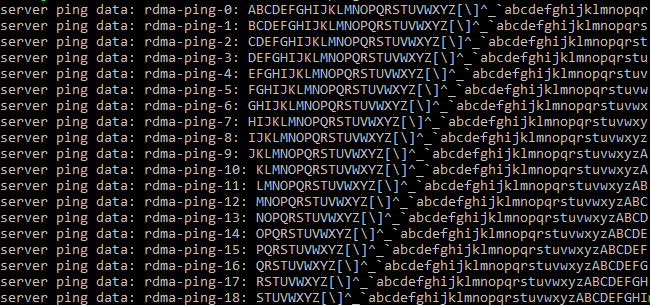
Here’s the output that one gets if all NICs support RDMA.
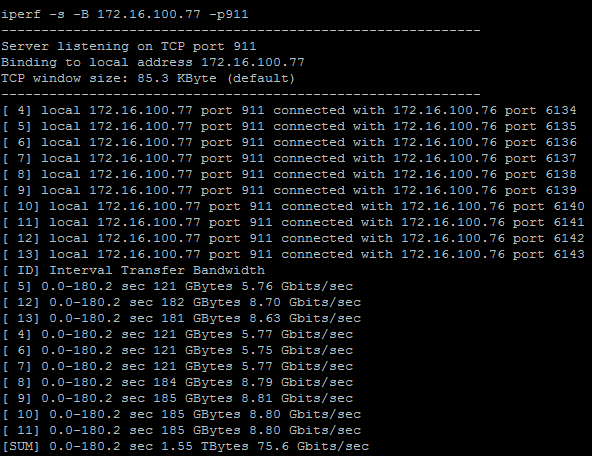
Now, let’s measure Chelsio T62100 LP-CR TCP network throughput with iPerf.
Now, let’s measure RDMA network throughput with rPerf. Setup configuration was just the same as for iPerf: one host was flagged as a client while other was set to the server mode. Here’s RDMA performance measured in 4KB blocks.

(4365.40*8)/1024 = 34.10 Gbps
Now, let’s measure RDMA throughput in 64k blocks.

(10221.02*8)/1024=79.85 Gbps
Discussion
I did not expect network throughput to be that low. I hope that it won’t be a problem for today’s tests.
CONFIGURING THE TARGET AND INITIATOR
Install nvmecli
First, install nvmecli on SPN77
git clone https://github.com/linux-nvme/nvme-cli.git

cd nvme-cli

make

make install
Start initiator on the “client” side
modprobe nvme-rdma

modprobe nvme
Setting up the RAM disk
In this article, I created the RAM disk with targetcli (http://linux-iscsi.org/wiki/Targetcli). Here’s the command which I used for that purpose:
yum install targetcli –y
Run these commands to have targetcli working even after rebooting the host.
systemctl start target

systemctl enable target
Then, connect the RAM disk as a block device to the system. Today, I use a 1GB device.
##### Create the RAM disk with this command:

targetcli /backstores/ramdisk create 1 1G

##### Create a loopback mount point (naa.5001*****).

targetcli /loopback/ create naa.500140591cac7a64

##### And, connect the RAM disk to the loopback mount point.

targetcli /loopback/naa.500140591cac7a64/luns create /backstores/ramdisk/1
With lsblk, check whether the RAM disk was successfully created.

In my case, RAM disk is presented as the /dev/sdb directory.
Setting up the Target on SPN77
It is necessary to download SPDK (https://spdk.io/doc/about.html) first.
git clone https://github.com/spdk/spdk

cd spdk

git submodule update –init

##### Install the package automatically using the command below.

sudo scripts/pkgdep.sh

##### Configure SPDK and enable RDMA.

./configure --with-rdma

Make

##### Now, you can start working with SPDK.

sudo scripts/setup.sh
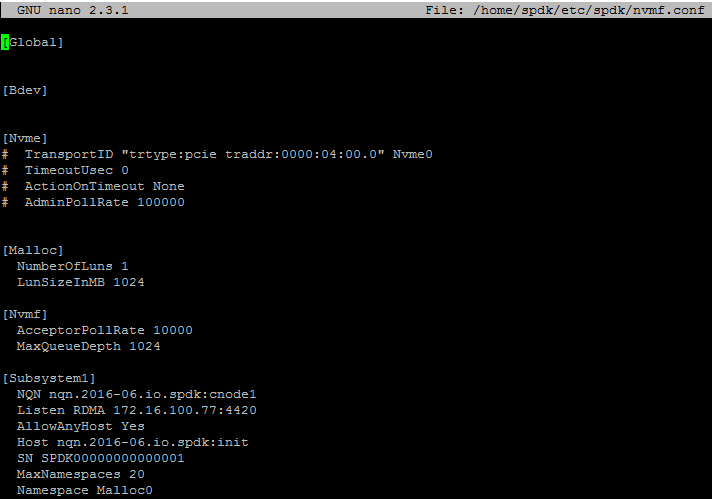
Here’s what a configuration retrieved from nvmf.conf is like (spdk/etc/spdk/).
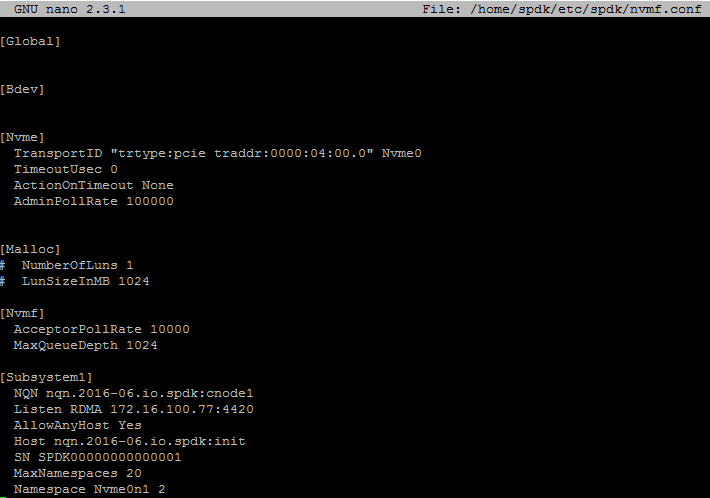
Here’s the config file for Intel Optane 900P benchmarking.
Start the target with the command below:
cd spdk/app/nvmf_tgt

./nvmf_tgt -c ../../etc/spdk/nvmf.conf
Setting up the Initiator SPN76
NOTE: It is necessary to disable iWARP Port Manager Deamon user space service, iwpmd, for the Target host. Here is the command for doing that:
systemctl stop iwpmd
Check whether iwpmd was successfully disabled with systemctl status iwpmd. Here’s the output if the service is disabled.

Now, you can finally start Chelsio UWIRE installation.
Installing Chelsio UWIRE
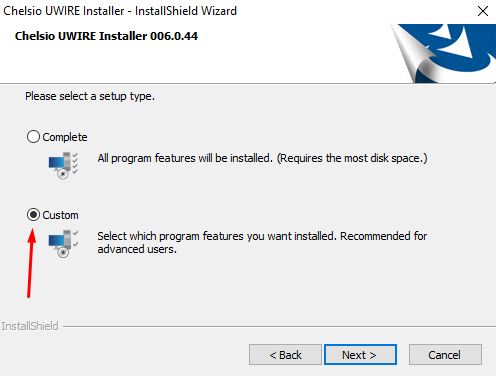
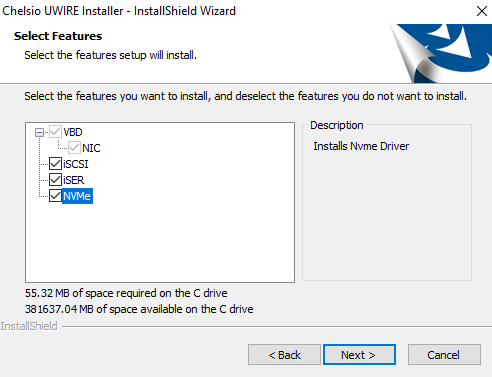
Now, start Chelsio NVMe Initiator Tool (C:\Windows\System32\nvmetool.exe). I started it remotely with PowerShell.

I guess that it may be interesting to read more about the commands used here.
nvmetool returns the list of available commands.
nvmetool EnumDevices lists NetIdx and NIC locations. With this command, you can also learn which NIC-s support RDMA.
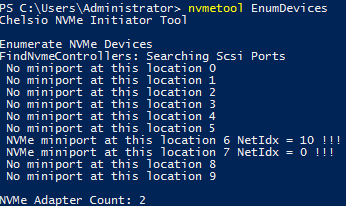
nvmetool ConnectTarget allows connecting to the target (NIC) to NVMe disk. You need to specify the NIC location and IP of the desired disk.
With Get-NetAdapter, you can see settings for all NIC-s and acquire the ifIndex of one that you need. Note that ifIndex value means just the same thing here as NetIdx.
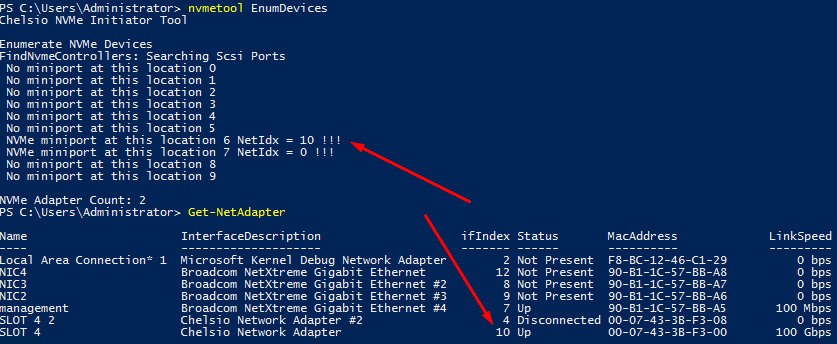

nvmetool RemoveTarget disconnects the specific NIC from an NVMe target. Just enter NIC location and NVMe disk TargetId to run the command.
nvmetool IdentifyTargets returns the list of active NVMe targets.
HOW I MEASURED EVERYTHING HERE
Before I move any further, here’s an overview of how I do all the measurements.
1. Creating a RAM disk with targetcli. This disk was connected as a local block device and had its performance measured with FIO. RAM disk performance measured at this stage was used as a reference since it was the maximum performance that RAM disk could deliver in my setup.
2. Creating Linux SPDK NVMe-oF Target which resides on the RAM disk on the Target host (SPN77). The disk was subsequently connected over loopback to Linux NVMe-oF Initiator that resides on the same host. Eventually, I benchmarked the device performance and compared it to the RAM disk performance measured before. In SPDK, RAM disk is called Malloc, so I sometimes referred it under this name herein.
3. Connecting Malloc on SPN77 to SPN67. Create SPDK NVMe-oF Target on the RAM disk. Present it to Chelsio NVMe-oF Initiator over RDMA. Benchmark RAM disk performance.
4. Connect Optane 900P to SPN77 and check its performance with FIO. It will be used as a reference for further measurements.
5. Afterward, connect the drive to Linux NVMe-oF Initiator on the same host using SPDK NVMe-oF Target. Check disk performance.
6. Present the NVMe drive to Chelsio NVMe-oF Initiator installed on SPN76. Measure performance of the disk while it is presented over the network.
In this article, I tested RAM disk performance with FIO (https://github.com/axboe/fio).
There are two ways of how you can install this utility. You can either run the command below:
sudo yum install fio –y
Or, install it from the source using this set of commands:
git clone https://github.com/axboe/fio.git

cd fio/

./configure

make && make install
Finding the optimal test utility settings for benchmarking the RAM disk
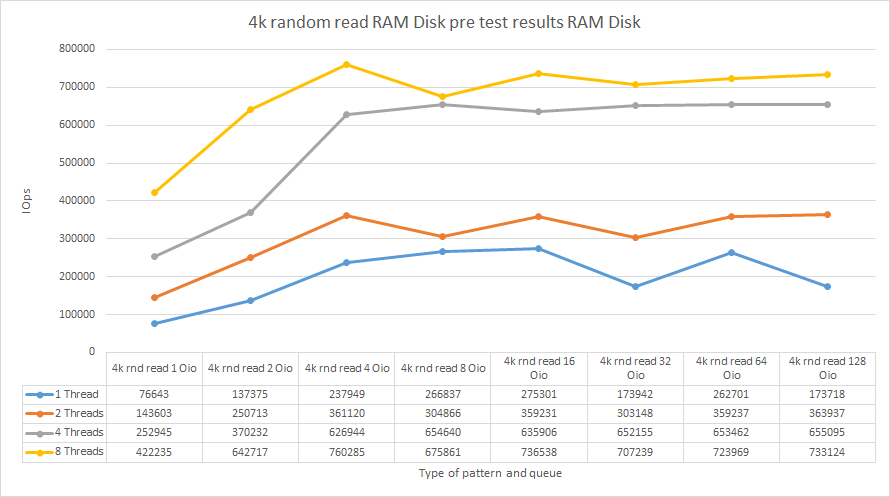
Before starting the performance measurements on any gear, it is important to identify such test utility settings (number of threads and queue depth) that ensure the highest possible hardware performance. To find the optimal test utility parameters, I measured random reading performance in 4k blocks while varying iodepth value (queue depth) for different numbers of threads (numjobs = 1, 2, 4, 8). Here is an example of how the FIO listing looked like.
[global]

numjobs=1

loops=1

time_based

ioengine=libaio

direct=1

runtime=60

filename=/dev/sdb

[4k-rnd-read-o1]

bs=4k

iodepth=1

rw=randread

stonewall

[4k-rnd-read-o2]

bs=4k

iodepth=2

rw=randread

stonewall

[4k-rnd-read-o4]

bs=4k

iodepth=4

rw=randread

stonewall

[4k-rnd-read-o8]

bs=4k

iodepth=8

rw=randread

stonewall

[4k-rnd-read-o16]

bs=4k

iodepth=16

rw=randread

stonewall

[4k-rnd-read-o32]

bs=4k

iodepth=32

rw=randread

stonewall

[4k-rnd-read-o64]

bs=4k

iodepth=64

rw=randread

stonewall

[4k-rnd-read-o128]

bs=4k

iodepth=128

rw=randread

stonewall
Now, let’s take look at results.
Pre-testing RAM disk (local)
| RAM disk (local) pre-test | ||||
|---|---|---|---|---|
| 1 Thread | 2 Threads | 4 Threads | 8 Threads | |
| Job name | Total IOPS | Total IOPS | Total IOPS | Total IOPS |
| 4k rnd read 1 Oio | 76643 | 143603 | 252945 | 422235 |
| 4k rnd read 2 Oio | 137375 | 250713 | 370232 | 642717 |
| 4k rnd read 4 Oio | 237949 | 361120 | 626944 | 760285 |
| 4k rnd read 8 Oio | 266837 | 304866 | 654640 | 675861 |
| 4k rnd read 16 Oio | 275301 | 359231 | 635906 | 736538 |
| 4k rnd read 32 Oio | 173942 | 303148 | 652155 | 707239 |
| 4k rnd read 64 Oio | 262701 | 359237 | 653462 | 723969 |
| 4k rnd read 128 Oio | 173718 | 363937 | 655095 | 733124 |
Discussion
According to the plot above, numjobs = 8 and iodepth = 4 should be used as the test utility parameters. This being said, here’s how FIO listing looked like:
[global]

numjobs=8

iodepth=4

loops=1

time_based

ioengine=libaio

direct=1

runtime=60

filenam

bs=4k

stonewall

[4k random write]

rw=randwrite

bs=4k

stonewall

[64k sequential write]

rw=write

bs=64k

stonewall

[64k random write]

rw=randwrite

bs=64k

stonewall

[4k sequential read]

rw=read

bs=4k

stonewall

[4k random read]

rw=randread

bs=4k

stonewall

[64k sequential read]

rw=read

bs=64k

stonewall

[64k random read]

rw=randread

bs=64k

stonewall

[4k sequential 50write]

rw=write

rwmixread=50

bs=4k

stonewall

[4k random 50write]

rw=randwrite

rwmixread=50

bs=4k

stonewall

[64k sequential 50write]

rw=write

rwmixread=50

bs=64k

stonewall

[64k random 50write]

rw=randwrite

rwmixread=50

bs=64k

stonewall

[8k random 70write]

bs=8k

rwmixread=70

rw=randrw

stonewall

e=/dev/sdb

[4k sequential write]

rw=write
BENCHMARKING THE RAM DISK
RAM disk performance (connected over loopback)
| RAM Disk loopback (127.0.0.1) Linux SPDK NVMe-oF Target | |||
|---|---|---|---|
| Job name | Total IOPS | Total bandwidth (MB/s) | Average latency (ms) |
| 4k random 50write | 709451 | 2771.30 | 0.04 |
| 4k random read | 709439 | 2771.26 | 0.04 |
| 4k random write | 703042 | 2746.27 | 0.04 |
| 4k sequential 50write | 715444 | 2794.71 | 0.04 |
| 4k sequential read | 753439 | 2943.14 | 0.04 |
| 4k sequential write | 713012 | 2785.22 | 0.05 |
| 64k random 50write | 79322 | 4957.85 | 0.39 |
| 64k random read | 103076 | 6442.53 | 0.30 |
| 64k random write | 78188 | 4887.01 | 0.40 |
| 64k sequential 50write | 81830 | 5114.63 | 0.38 |
| 64k sequential read | 131613 | 8226.06 | 0.23 |
| 64k sequential write | 79085 | 4943.10 | 0.39 |
| 8k random 70% write | 465745 | 3638.69 | 0.07 |
RAM disk performance (presented over RDMA)
| RAM disk on Linux SPDK NVMe-oF Target – Chelsio NVMe-oF Initiator for Windows through Chelsio T62100 LP-CR 100 Gbps |
|||
|---|---|---|---|
| Job name | Total IOPS | Total bandwidth (MB/s) | Average latency (ms) |
| 4k random 50write | 258480 | 1009.70 | 0.08 |
| 4k random read | 272238 | 1063.44 | 0.07 |
| 4k random write | 261421 | 1021.18 | 0.08 |
| 4k sequential 50write | 264896 | 1034.76 | 0.08 |
| 4k sequential read | 275675 | 1076.87 | 0.07 |
| 4k sequential write | 259782 | 1014.79 | 0.08 |
| 64k random 50write | 66288 | 4143.17 | 0.45 |
| 64k random read | 82404 | 5150.49 | 0.36 |
| 64k random write | 66310 | 4144.67 | 0.45 |
| 64k sequential 50write | 67307 | 4207.04 | 0.45 |
| 64k sequential read | 92199 | 5762.73 | 0.32 |
| 64k sequential write | 69201 | 4325.34 | 0.43 |
| 8k random 70% write | 257337 | 2010.51 | 0.08 |
CAN I SQUEEZE ALL THE IOPS OUT OF AN INTEL OPTANE 900P?
In this part, I’m going to see whether Chelsio NVMe-oF Initiator can ensure the highest possible performance of an NVMe drive that is presented over RDMA.
Setting up the test utilityh
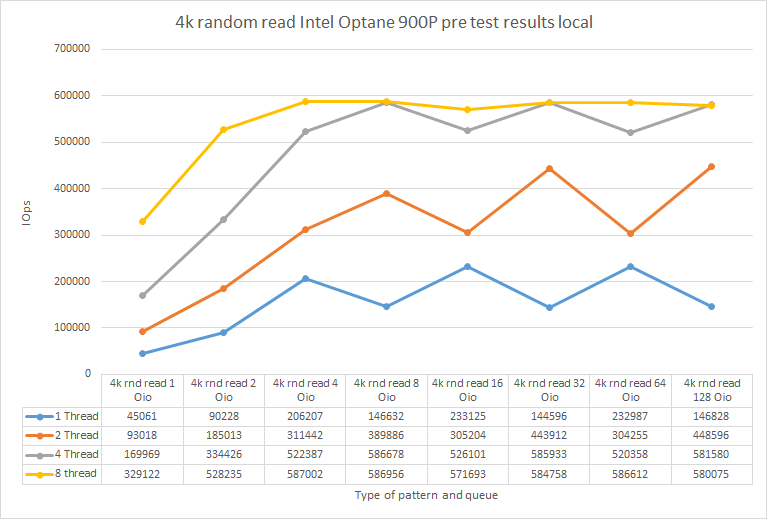
First, I need to decide on the optimal test htility settings. I run the test under 4k random read pattern while playing around with outstanding IO for different numbers of threads.
Here are the numbers I got.
| 1 Thread | 2 Threads | 4 Threads | 8 Threads | |
|---|---|---|---|---|
| Job name | Total IOPS | Total IOPS | Total IOPS | Total IOPS |
| 4k rnd read 1 Oio | 45061 | 93018 | 169969 | 329122 |
| 4k rnd read 2 Oio | 90228 | 185013 | 334426 | 528235 |
| 4k rnd read 4 Oio | 206207 | 311442 | 522387 | 587002 |
| 4k rnd read 8 Oio | 146632 | 389886 | 586678 | 586956 |
| 4k rnd read 16 Oio | 233125 | 305204 | 526101 | 571693 |
| 4k rnd read 32 Oio | 144596 | 443912 | 585933 | 584758 |
| 4k rnd read 64 Oio | 232987 | 304255 | 520358 | 586612 |
| 4k rnd read 128 Oio | 146828 | 448596 | 581580 | 580075 |
Discussion
The highest performance was observed under numjobs = 8 iodepth = 4. So, they were the test utility parameters for today!
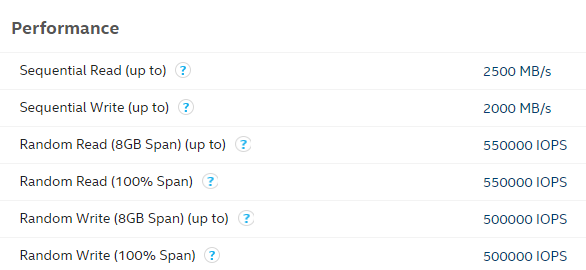
Good news: My disk’s performance aligned with the numbers from Intel’s datasheet: https://ark.intel.com/content/www/us/en/ark/products/123628/intel-optane-ssd-900p-series-280gb-1-2-height-pcie-x4-20nm-3d-xpoint.html.
Intel Optane 900P performance (connected over loopback)
| Intel Optane 900P loopback (127.0.0.1) Linux SPDK NVMe-oF Target | |||
|---|---|---|---|
| Job name | Total IOPS | Total bandwidth (MB/s) | Average latency (ms) |
| 4k random 50write | 550744 | 2151.35 | 0.05 |
| 4k random read | 586964 | 2292.84 | 0.05 |
| 4k random write | 550865 | 2151.82 | 0.05 |
| 4k sequential 50write | 509616 | 1990.70 | 0.06 |
| 4k sequential read | 590101 | 2305.09 | 0.05 |
| 4k sequential write | 537876 | 2101.09 | 0.06 |
| 64k random 50write | 34566 | 2160.66 | 0.91 |
| 64k random read | 40733 | 2546.02 | 0.77 |
| 64k random write | 34590 | 2162.01 | 0.91 |
| 64k sequential 50write | 34201 | 2137.77 | 0.92 |
| 64k sequential read | 41418 | 2588.87 | 0.76 |
| 64k sequential write | 34499 | 2156.53 | 0.91 |
| 8k random 70% write | 256435 | 2003.45 | 0.12 |
Intel Optane 900P performance (presented over RDMA)
| Intel Optane 900P on Linux SPDK NVMe-oF Target – Chelsio NVMe-oF Initiator for Windows through Chelsio T62100 LP-CR 100 Gbps |
|||
|---|---|---|---|
| Job name | Total IOPS | Total bandwidth (MB/s) | Average latency (ms) |
| 4k random 50write | 252095 | 984.76 | 0.08 |
| 4k random read | 262672 | 1026.07 | 0.08 |
| 4k random write | 253537 | 990.39 | 0.08 |
| 4k sequential 50write | 258780 | 1010.87 | 0.08 |
| 4k sequential read | 268382 | 1048.38 | 0.08 |
| 4k sequential write | 254299 | 993.37 | 0.08 |
| 64k random 50write | 33888 | 2118.26 | 0.92 |
| 64k random read | 40649 | 2540.81 | 0.76 |
| 64k random write | 33260 | 2079.03 | 0.94 |
| 64k sequential 50write | 31692 | 1981.07 | 0.99 |
| 64k sequential read | 40750 | 2547.18 | 0.76 |
| 64k sequential write | 32680 | 2042.69 | 0.96 |
| 8k random 70% write | 243304 | 1900.87 | 0.09 |
RESULTS
RAM disk
| RAM Disk Linux Local | RAM Disk loopback (127.0.0.1) Linux SPDK NVMe-oF Target | RAM Disk on Linux SPDK NVMe-oF Target – Chelsio NVMe-oF Initiator for Windows through Chelsio T62100 LP-CR 100 Gbps |
|||||||
|---|---|---|---|---|---|---|---|---|---|
| Job name | Total IOPS | Total bandwidth (MB/s) | Average latency (ms) | Total IOPS | Total bandwidth (MB/s) | Average latency (ms) | Total IOPS | Total bandwidth (MB/s) | Average latency (ms) |
| 4k random 50write | 458958 | 1792.81 | 0.07 | 709451 | 2771.30 | 0.04 | 258480 | 1009.70 | 0.08 |
| 4k random read | 558450 | 2181.45 | 0.05 | 709439 | 2771.26 | 0.04 | 272238 | 1063.44 | 0.07 |
| 4k random write | 460132 | 1797.40 | 0.07 | 703042 | 2746.27 | 0.04 | 261421 | 1021.18 | 0.08 |
| 4k sequential 50write | 525996 | 2054.68 | 0.06 | 715444 | 2794.71 | 0.04 | 264896 | 1034.76 | 0.08 |
| 4k sequential read | 656666 | 2565.11 | 0.05 | 753439 | 2943.14 | 0.04 | 275675 | 1076.87 | 0.07 |
| 4k sequential write | 520115 | 2031.71 | 0.06 | 713012 | 2785.22 | 0.05 | 259782 | 1014.79 | 0.08 |
| 64k random 50write | 50641 | 3165.26 | 0.62 | 79322 | 4957.85 | 0.39 | 66288 | 4143.17 | 0.45 |
| 64k random read | 69812 | 4363.57 | 0.45 | 103076 | 6442.53 | 0.30 | 82404 | 5150.49 | 0.36 |
| 64k random write | 50525 | 3158.06 | 0.62 | 78188 | 4887.01 | 0.40 | 66310 | 4144.67 | 0.45 |
| 64k sequential 50write | 58900 | 3681.56 | 0.53 | 81830 | 5114.63 | 0.38 | 67307 | 4207.04 | 0.45 |
| 64k sequential read | 73434 | 4589.86 | 0.42 | 131613 | 8226.06 | 0.23 | 92199 | 5762.73 | 0.32 |
| 64k sequential write | 57200 | 3575.31 | 0.54 | 79085 | 4943.10 | 0.39 | 69201 | 4325.34 | 0.43 |
| 8k random 70% write | 337332 | 2635.47 | 0.09 | 465745 | 3638.69 | 0.07 | 257337 | 2010.51 | 0.08 |
Intel Optane 900P
| Intel Optane 900P Linux local | Intel Optane 900P loopback (127.0.0.1) Linux SPDK NVMe-oF Target | Intel Optane 900P on Linux SPDK NVMe-oF Target – Chelsio NVMe-oF Initiator for Windows through Chelsio T62100 LP-CR 100 Gbps |
|||||||
|---|---|---|---|---|---|---|---|---|---|
| Job name | Total IOPS | Total bandwidth (MB/s) | Average latency (ms) | Total IOPS | Total bandwidth (MB/s) | Average latency (ms) | Total IOPS | Total bandwidth (MB/s) | Average latency (ms) |
| 4k random 50write | 542776 | 2120.23 | 0.05 | 550744 | 2151.35 | 0.05 | 252095 | 984.76 | 0.08 |
| 4k random read | 586811 | 2292.24 | 0.05 | 586964 | 2292.84 | 0.05 | 262672 | 1026.07 | 0.08 |
| 4k random write | 526649 | 2057.23 | 0.06 | 550865 | 2151.82 | 0.05 | 253537 | 990.39 | 0.08 |
| 4k sequential 50write | 323441 | 1263.45 | 0.09 | 509616 | 1990.70 | 0.06 | 258780 | 1010.87 | 0.08 |
| 4k sequential read | 595622 | 2326.66 | 0.05 | 590101 | 2305.09 | 0.05 | 268382 | 1048.38 | 0.08 |
| 4k sequential write | 416667 | 1627.61 | 0.07 | 537876 | 2101.09 | 0.06 | 254299 | 993.37 | 0.08 |
| 64k random 50write | 34224 | 2139.32 | 0.92 | 34566 | 2160.66 | 0.91 | 33888 | 2118.26 | 0.92 |
| 64k random read | 40697 | 2543.86 | 0.77 | 40733 | 2546.02 | 0.77 | 40649 | 2540.81 | 0.76 |
| 64k random write | 33575 | 2098.76 | 0.94 | 34590 | 2162.01 | 0.91 | 33260 | 2079.03 | 0.94 |
| 64k sequential 50write | 34462 | 2154.10 | 0.91 | 34201 | 2137.77 | 0.92 | 31692 | 1981.07 | 0.99 |
| 64k sequential read | 41369 | 2585.79 | 0.76 | 41418 | 2588.87 | 0.76 | 40750 | 2547.18 | 0.76 |
| 64k sequential write | 34435 | 2152.52 | 0.91 | 34499 | 2156.53 | 0.91 | 32680 | 2042.69 | 0.96 |
| 8k random 70% write | 256307 | 2002.46 | 0.12 | 256435 | 2003.45 | 0.12 | 243304 | 1900.87 | 0.09 |
Discussion
Even though there were some problems with network throughput, networking did not bottleneck the disk performance.
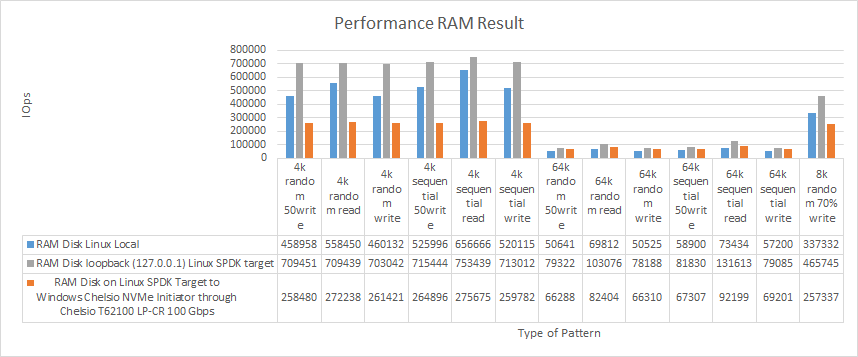
Let’s discuss the numbers in detail now. On RAM disk, I could not get the performance that would match the IOPS observed while RAM disk was connected over loopback with Linux SPDK NVMe-oF Initiator. On the other hand, in 64k blocks, RAM disk presented over the network did better than while it was connected locally (there were 10 000-14 000 IOPS of performance gain).
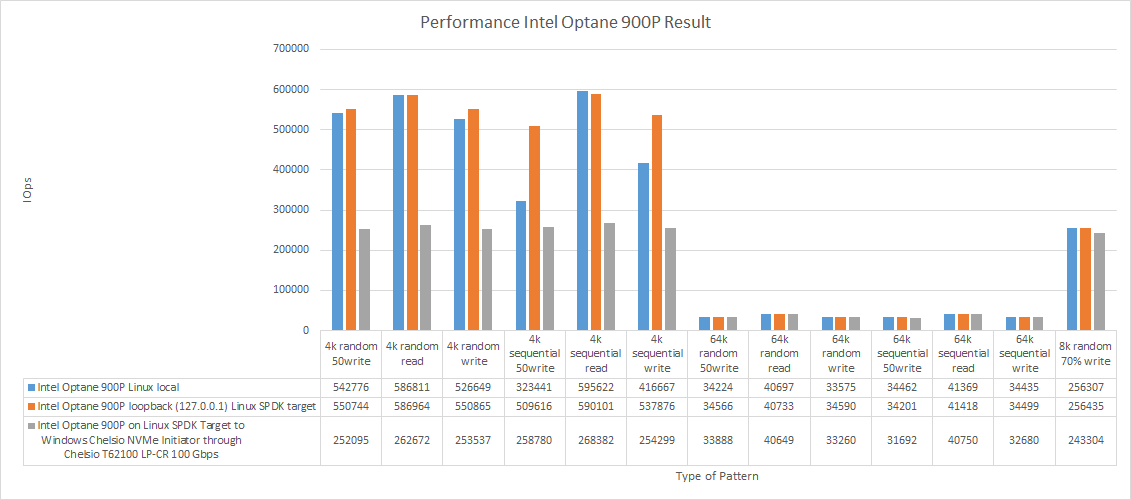
Now, let’s talk about NVMe drive performance. Being presented over the network, Intel Optane 900P exhibits lower performance in 4k blocks than while being connected locally. For performance in 64k blocks, though I did not see any performance difference between the disk connected locally and one presented over the network.
In general, Chelsio NVMe-oF Initiator for Windows cannot be used effectively for workloads in small blocks. It cuts off almost half of the presented device performance. On the other hand, Initiator works well for 64k blocks and 8k OLTP workload.
Now, I’d like to compare Chelsio NVMe-oF Initiator and Linux NVMe-oF Initiator (https://www.starwindsoftware.com/blog/hyper-v/nvme-part-1-linux-nvme-initiator-linux-spdk-nvmf-target/) performance. I’ll do that in the fourth part of this study anyway, but I just cannot wait to see both solutions standing face to face.

What about the latency?
Performance is an important characteristic, but the study will not be complete without latency measurements! FIO settings: numjobs = 1 iodepth = 1.
RAM disk
| RAM Disk Linux (local) | RAM Disk on Linux SPDK NVMe-oF Target – Chelsio NVMe-oF Initiator for Windows through Chelsio T62100 LP-CR 100 Gbps |
|||||
|---|---|---|---|---|---|---|
| Job name | Total IOPS | Total bandwidth (MB/s) | Average latency (ms) | Total IOPS | Total bandwidth (MB/s) | Average latency (ms) |
| 4k random 50write | 97108 | 379.33 | 0.0069433 | 17269 | 67.46 | 0.0404688 |
| 4k random read | 114417 | 446.94 | 0.0056437 | 17356 | 67.80 | 0.0402686 |
| 4k random write | 95863 | 374.46 | 0.0070643 | 14821 | 57.90 | 0.0432964 |
| 4k sequential 50write | 107010 | 418.01 | 0.0061421 | 18134 | 70.84 | 0.0390418 |
| 4k sequential read | 117168 | 457.69 | 0.0054994 | 17452 | 68.17 | 0.0404430 |
| 4k sequential write | 98065 | 383.07 | 0.0068343 | 17437 | 68.12 | 0.0398902 |
| 64k random 50write | 27901 | 1743.87 | 0.0266555 | 13558 | 847.38 | 0.0459828 |
| 64k random read | 36098 | 2256.14 | 0.0203593 | 14099 | 881.25 | 0.0449975 |
| 64k random write | 28455 | 1778.48 | 0.0260830 | 13607 | 850.50 | 0.0476149 |
| 64k sequential 50write | 28534 | 1783.42 | 0.0262397 | 11151 | 697.00 | 0.0700821 |
| 64k sequential read | 36727 | 2295.44 | 0.0200747 | 14616 | 913.50 | 0.0450857 |
| 64k sequential write | 28988 | 1811.78 | 0.0256918 | 13605 | 850.34 | 0.0506481 |
| 8k random 70% write | 85051 | 664.47 | 0.0083130 | 17630 | 137.74 | 0.0398817 |
Intel Optane
| Intel Optane 900P Linux local | Intel Optane 900P on Linux SPDK NVMe-oF Target – Chelsio NVMe oF Initiator for Windows through Chelsio T62100 LP-CR 100 Gbps | |||||
|---|---|---|---|---|---|---|
| Job name | Total IOPS | Total bandwidth (MB/s) | Average latency (ms) | Total IOPS | Total bandwidth (MB/s) | Average latency (ms) |
| 4k random 50write | 73097 | 285.54 | 0.0108380 | 14735 | 57.56 | 0.0437604 |
| 4k random read | 82615 | 322.72 | 0.0093949 | 17751 | 69.34 | 0.0408734 |
| 4k random write | 73953 | 288.88 | 0.0108047 | 11703 | 45.71 | 0.0690179 |
| 4k sequential 50write | 74555 | 291.23 | 0.0108105 | 11734 | 45.84 | 0.0676898 |
| 4k sequential read | 85858 | 335.39 | 0.0092789 | 17243 | 67.36 | 0.0418020 |
| 4k sequential write | 74998 | 292.96 | 0.0107804 | 11743 | 45.87 | 0.0675165 |
| 64k random 50write | 19119 | 1194.99 | 0.0423029 | 10654 | 665.90 | 0.0667292 |
| 64k random read | 22589 | 1411.87 | 0.0356328 | 10593 | 662.11 | 0.0766167 |
| 64k random write | 18762 | 1172.63 | 0.0427555 | 9629 | 601.81 | 0.0847440 |
| 64k sequential 50write | 19320 | 1207.54 | 0.0423435 | 10656 | 666.06 | 0.0655762 |
| 64k sequential read | 22927 | 1432.96 | 0.0353837 | 11724 | 732.77 | 0.0642400 |
| 64k sequential write | 18663 | 1166.44 | 0.0429796 | 10536 | 658.52 | 0.0724088 |
| 8k random 70% write | 72212 | 564.16 | 0.0114044 | 14761 | 115.33 | 0.0555947 |
CONCLUSION
In this study, I measured the performance of the disk presented with Linux SPDK NVMe-oF Target + Chelsio NVMe-oF Initiator for Windows. The main idea was to check whether solutions that bring NVMe-oF to Windows can unleash the whole potential of NVMe SSD-s. In small blocks, Chelsio NVMe-oF for Windows cannot do that; in large blocks, it can.
I have one more NVMe-oF initiator to go: StarWind NVMe-oF Initiator. It is another solution for Windows, so it may be really interesting for you to see its performance. Here’s my article on StarWind NVMe-oF Initiator.
from StarWind Blog https://ift.tt/OkYKwuH
via IFTTT
No comments:
Post a Comment