WHY
Prometheus is a powerful and flexible toolkit for monitoring and alerting, designed to handle modern, highly dynamic environments easily. Its ability to efficiently collect, store, and query time-series data and robust alerting and visualization capabilities make it a popular choice for infrastructure and application monitoring. Its extensibility and integration with other tools like Grafana further enhance its utility in diverse monitoring scenarios. Prometheus is not a direct successor to SNMP but an addition that brings powerful capabilities for modern monitoring needs.
WHO
Prometheus is widely used across various industries due to its flexibility, scalability, and powerful capabilities in monitoring and alerting. TNSR customers that require real-time insights into their network infrastructure, need to ensure high availability, and want to automate their incident response processes typically benefit the most from Prometheus. Its ability to integrate with modern cloud-native environments and its extensive ecosystem make it a critical tool for DevOps, SRE (Site Reliability Engineering), and IT operations teams.
How It Works
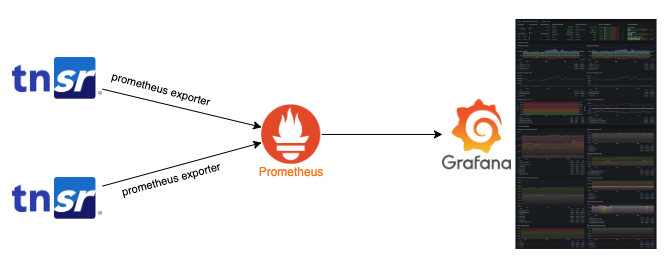
- The Prometheus Exporter needs to be enabled on TNSR by following this procedure. TNSR includes a Prometheus exporter which supports statistical data from the dataplane (VPP) only. Once enabled, the service listens for connections on TCP port 9482 and can be accessed on http://<IP address>/metrics.
- The Prometheus server (running separately on a dedicated server) queries metrics and stores them in the database.
- The Grafana server uses the Prometheus database as a data source. This involves specifying the URL of the Prometheus server in Grafana.
- Users create dashboards in Grafana, adding panels and using PromQL queries to fetch data from Prometheus, or download ready-to-use dashboards from the Grafana website, such as this dashboard.
Deployment Guide
High-level Steps
- Enable Prometheus on TNSR
- Install and configure Prometheus on the Ubuntu server
- Install and configure Grafana on the Ubuntu server
- Grafana Dashboard
In this deployment scenario, we are going to use a single server for Prometheus and Grafana, but it is recommended to have dedicated servers in production. Prometheus and Grafana will be installed on an Ubuntu server. Please refer to the Prometheus and Grafana documentation to see what options are available.
Enable Prometheus on TNSR
For a detailed explanation and possible configuration options, please refer to the Netgate documentation here. To enable Prometheus on TNSR, you only need to run a single command:
ubuntu$ prometheus host enable
Apply filters if required. For example, to filter only interfaces data you can run:
ubuntu$ prometheus host filter interfaces
Applying filters may be helpful if you have a busy configuration on TNSR, especially if you are running BGP with the full internet table. This may generate a large amount of traffic to your Prometheus server.
Install and Configure Prometheus on the Ubuntu Server
There are multiple ways to install Prometheus; we followed this article.
- Create a System User for Prometheus
ubuntu$ sudo groupadd --system prometheus
ubuntu$ sudo useradd -s /sbin/nologin --system -g prometheus prometheus
- Create Directories for Prometheus
ubuntu$ sudo mkdir /etc/prometheus
ubuntu$ sudo mkdir /var/lib/prometheus
- Download Prometheus and Extract Files
To download the latest update, go to the Prometheus Official Downloads site and copy the download link.
ubuntu$ wget https://ift.tt/4h7WABV
ubuntu$ tar vxf prometheus*.tar.gz
- Navigate to the Prometheus Directory
ubuntu$ cd prometheus*/
- Move the Binary Files & Set Owner
ubuntu$ sudo mv prometheus /usr/local/bin
ubuntu$ sudo mv promtool /usr/local/bin
ubuntu$ sudo chown prometheus:prometheus /usr/local/bin/prometheus
ubuntu$ sudo chown prometheus:prometheus /usr/local/bin/promtool
- Move the Configuration Files & Set Owner
ubuntu$ sudo mv consoles /etc/prometheus
ubuntu$ sudo mv console_libraries /etc/prometheus
ubuntu$ sudo mv prometheus.yml /etc/prometheus
ubuntu$ sudo chown prometheus:prometheus /etc/prometheus
ubuntu$ sudo chown -R prometheus:prometheus /etc/prometheus/consoles
ubuntu$ sudo chown -R prometheus:prometheus /etc/prometheus/console_libraries
ubuntu$ sudo chown -R prometheus:prometheus /var/lib/prometheus
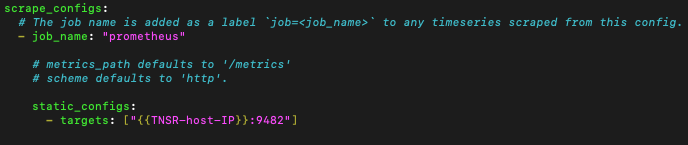
Update target IP address in prometheus configuration file:
ubuntu$ sudo nano /etc/prometheus/prometheus.yml
- Create Prometheus Systemd Service
Now, you need to create a system service file for Prometheus. Create and open a prometheus.service file with the Nano text editor using:
ubuntu$ sudo nano /etc/systemd/system/prometheus.service
Include these settings to the file, save, and exit:
[Unit]
Description=Prometheus
Wants=network-online.target
After=network-online.target
[Service]
User=prometheus
Group=prometheus
Type=simple
ExecStart=/usr/local/bin/prometheus \
--config.file /etc/prometheus/prometheus.yml \
--storage.tsdb.path /var/lib/prometheus/ \
--web.console.templates=/etc/prometheus/consoles \
--web.console.libraries=/etc/prometheus/console_libraries
[Install]
WantedBy=multi-user.target
ubuntu$ sudo systemctl daemon-reload
- Start Prometheus Service and check status
ubuntu$ sudo systemctl enable prometheus
ubuntu$ sudo systemctl start prometheus
ubuntu$ sudo systemctl status prometheus
Now you should have your Prometheus server up and running. You can access it via http://<server-ip>:9090/
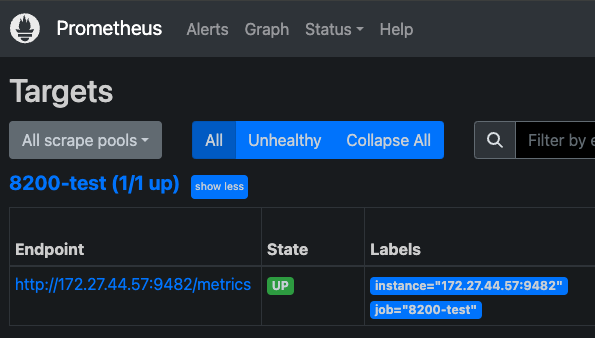
To verify that Prometheus can successfully pull metrics from TNSR, please go to Status > Targets. You should see your TNSR in the Endpoint column with the Green Status UP.
Install and Configure Grafana on the Ubuntu Server
For the Grafana installation, we used this procedure.
- Install the prerequisite packages:
ubuntu$ sudo apt-get install -y apt-transport-https software-properties-common wget
ubuntu$ sudo mkdir -p /etc/apt/keyrings/
ubuntu$ wget -q -O - https://ift.tt/lfaU3Cn | gpg --dearmor | sudo tee /etc/apt/keyrings/grafana.gpg > /dev/null
- To add a repository for stable releases, run the following command:
ubuntu$ echo "deb [signed-by=/etc/apt/keyrings/grafana.gpg] https://apt.grafana.com stable main" | sudo tee -a /etc/apt/sources.list.d/grafana.list
- Run the following command to update the list of available packages:
# Updates the list of available packages
ubuntu$ sudo apt-get update
- To install Grafana OSS, run the following command:
# Installs the latest OSS release:
ubuntu$ sudo apt-get install grafana
After the above steps your Grafana server should be accessible on http://<server-ip>:3000/ using default username and password admin/admin. It is recommended to update your password after first login.
Once in the Grafana Home Page please follow Connections > Data Source and type “Prometheus” in the search field to add your first Data Source, in our case - Prometheus Server.
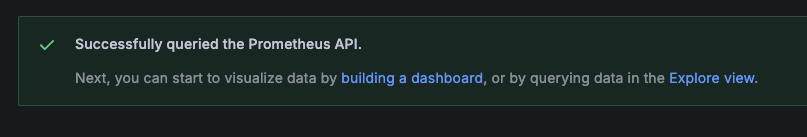
Type the name for your Data Source and http://localhost:9090 in the Connections URL field. This should be enough for your Data Source configuration.

Scroll down and click Save & Exit. You should see the below message that Grafana has successfully queried the Prometheus API.
Grafana Dashboard
The next step is to create your Dashboard. For this, you need to go to the Dashboard menu where you will have a couple of options. You can create it manually or import a dashboard pre-built by the community.

Pre-built Grafana Dashboards can be found on the Grafana website: https://grafana.com/grafana/dashboards/.
We recommend using this VPP Dashboard: https://grafana.com/grafana/dashboards/20315-vpp-performance-details/. You can download this Dashboard and import it by clicking the Import button in the Dashboard menu. Please note that this Dashboard requires VPP 24.02, which is available on TNSR Release 24.06. Although this Dashboard will work with an older version, some graphs which require VPP 24.02 won’t be displayed correctly. This is how the VPP Performance Details Dashboard panel looks once installed. It can be accessed in Dashboards.
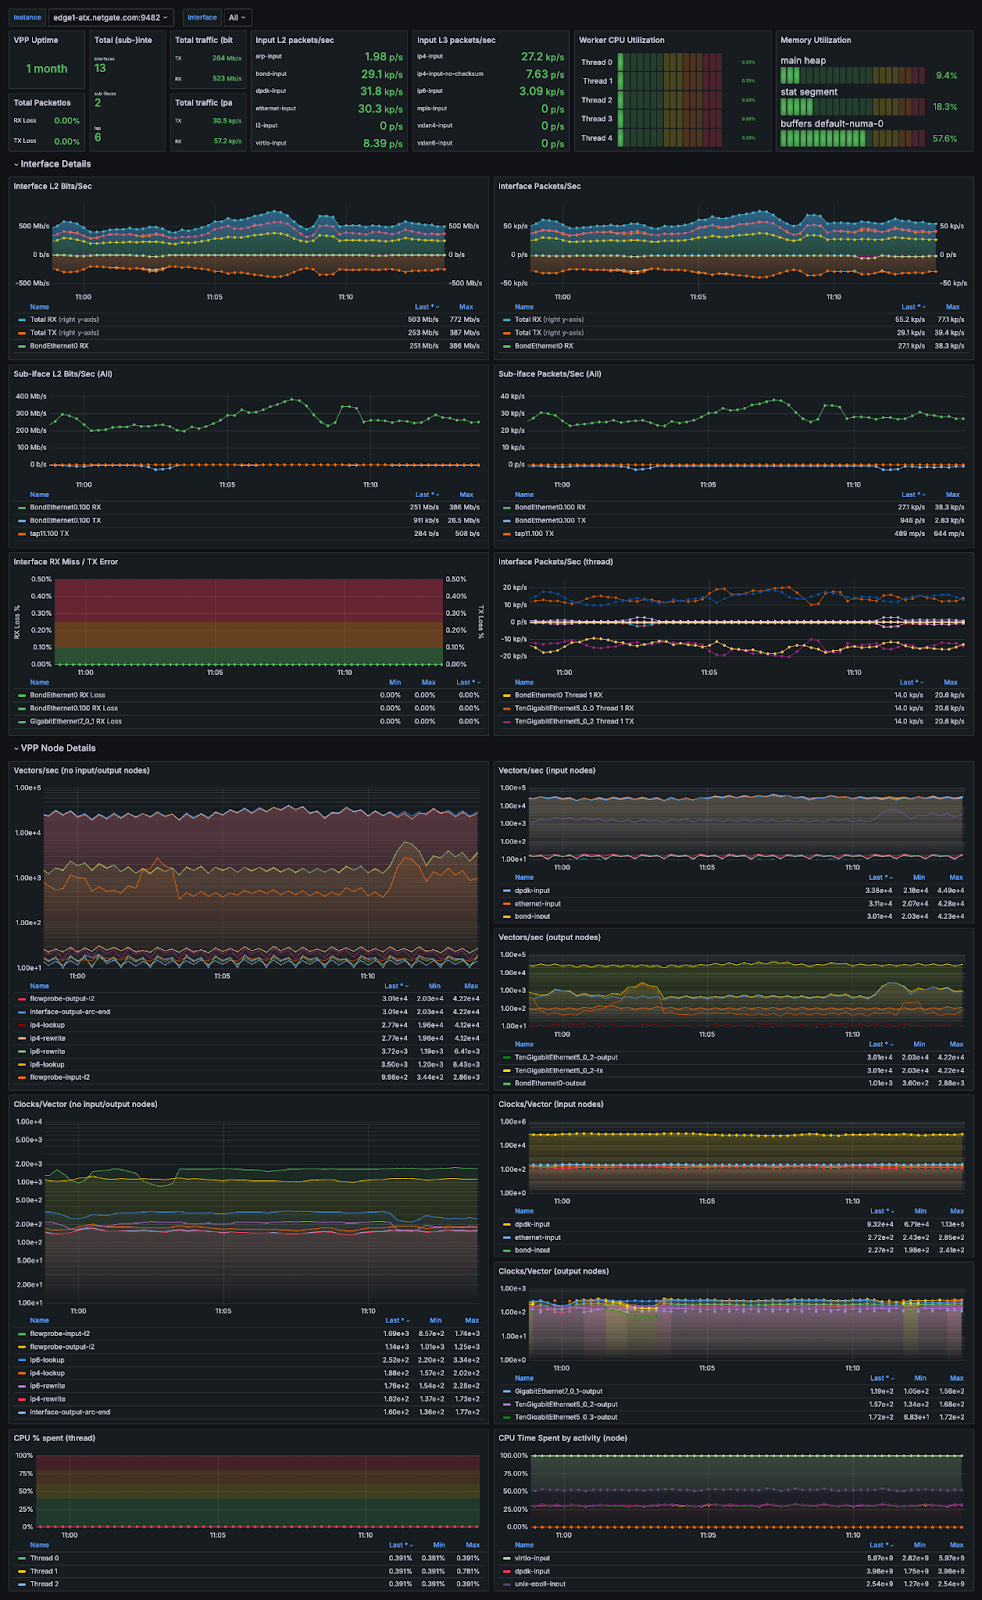
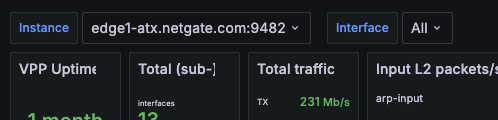
At the top of the dashboard, you will find a list of your instances and interfaces which you can browse.
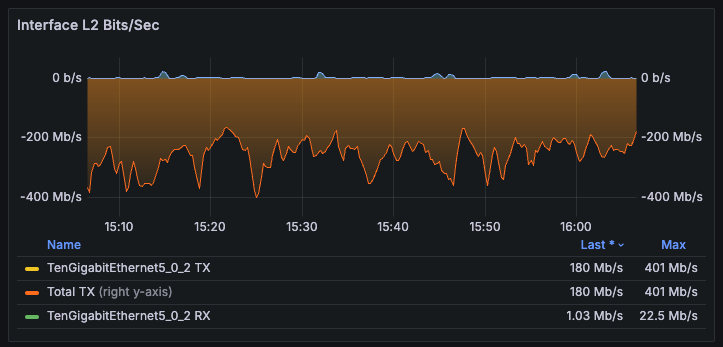
By selecting a specific interface, you will see graphs only for this interface
Summary
Using Prometheus on a TNSR router enhances network monitoring by providing detailed, scalable, and customizable metrics collection and analysis. The integration with Grafana further enriches the monitoring experience through advanced visualization capabilities. This combination allows network administrators to gain deep insights, proactively manage network health, and efficiently respond to potential issues, while benefiting from open-source tools' flexibility and extensibility.
from Blog https://ift.tt/bF0yUBm
via IFTTT
No comments:
Post a Comment