SentinelOne recently launched Singularity Operations Center, the new unified console, to centralize workflows and accelerate detection, triage, and investigation for an efficient and seamless analyst experience. This pivotal update includes integrated navigation to improve workflows and new and enhanced capabilities such as unified alerts management. Providing a deeper look into the Operations Center, this blog post focuses on how unified alert management enables faster and more comprehensive investigations for today’s security teams.
Accelerate Investigation with Centralized Alerts
Traditionally, security analysts must deploy multiple security tools to protect their organizations. Each individual tool manages alerts differently in addition to disconnected workflows among the tools themselves. With this approach, analysts are unable to correlate alerts across disparate solutions. This fragmented approach complicates the triage process, leading to an increased mean time to respond (MTTR) and potential oversight during an investigation.
To combat these challenges, SentinelOne developed the unified console to provide broader visibility and management across the security ecosystem. The Operations Center empowers teams to consolidate and centralize all security alerts into a single cohesive queue, including those from SentinelOne native solutions and industry-leading partners. This approach eliminates the need to pivot among disconnected consoles and work within disjointed workflows, providing seamless SOC workflows and facilitating rapid response to threats.
Use Case | Investigating a Lockbit Ransomware Infection
Engineered for speed and efficiency, LockBit is an advanced and pervasive ransomware strain. It leverages sophisticated encryption algorithms to rapidly lock down critical data within targeted networks. LockBit employs double extortion techniques, where attackers exfiltrate sensitive data before encryption and threaten to publish it on dedicated leak sites if their demands are unmet. It operates under a Ransomware-as-a-Service (RaaS) model, enabling affiliates to deploy the malware in exchange for a portion of ransom proceeds. Its attack vectors often include exploitation of vulnerabilities, phishing, and lateral movement within compromised networks, making it a versatile and potent threat. Continuous updates and modular capabilities allow LockBit to bypass traditional security measures, emphasizing the need for advanced detection and response strategies in defending against this threat.
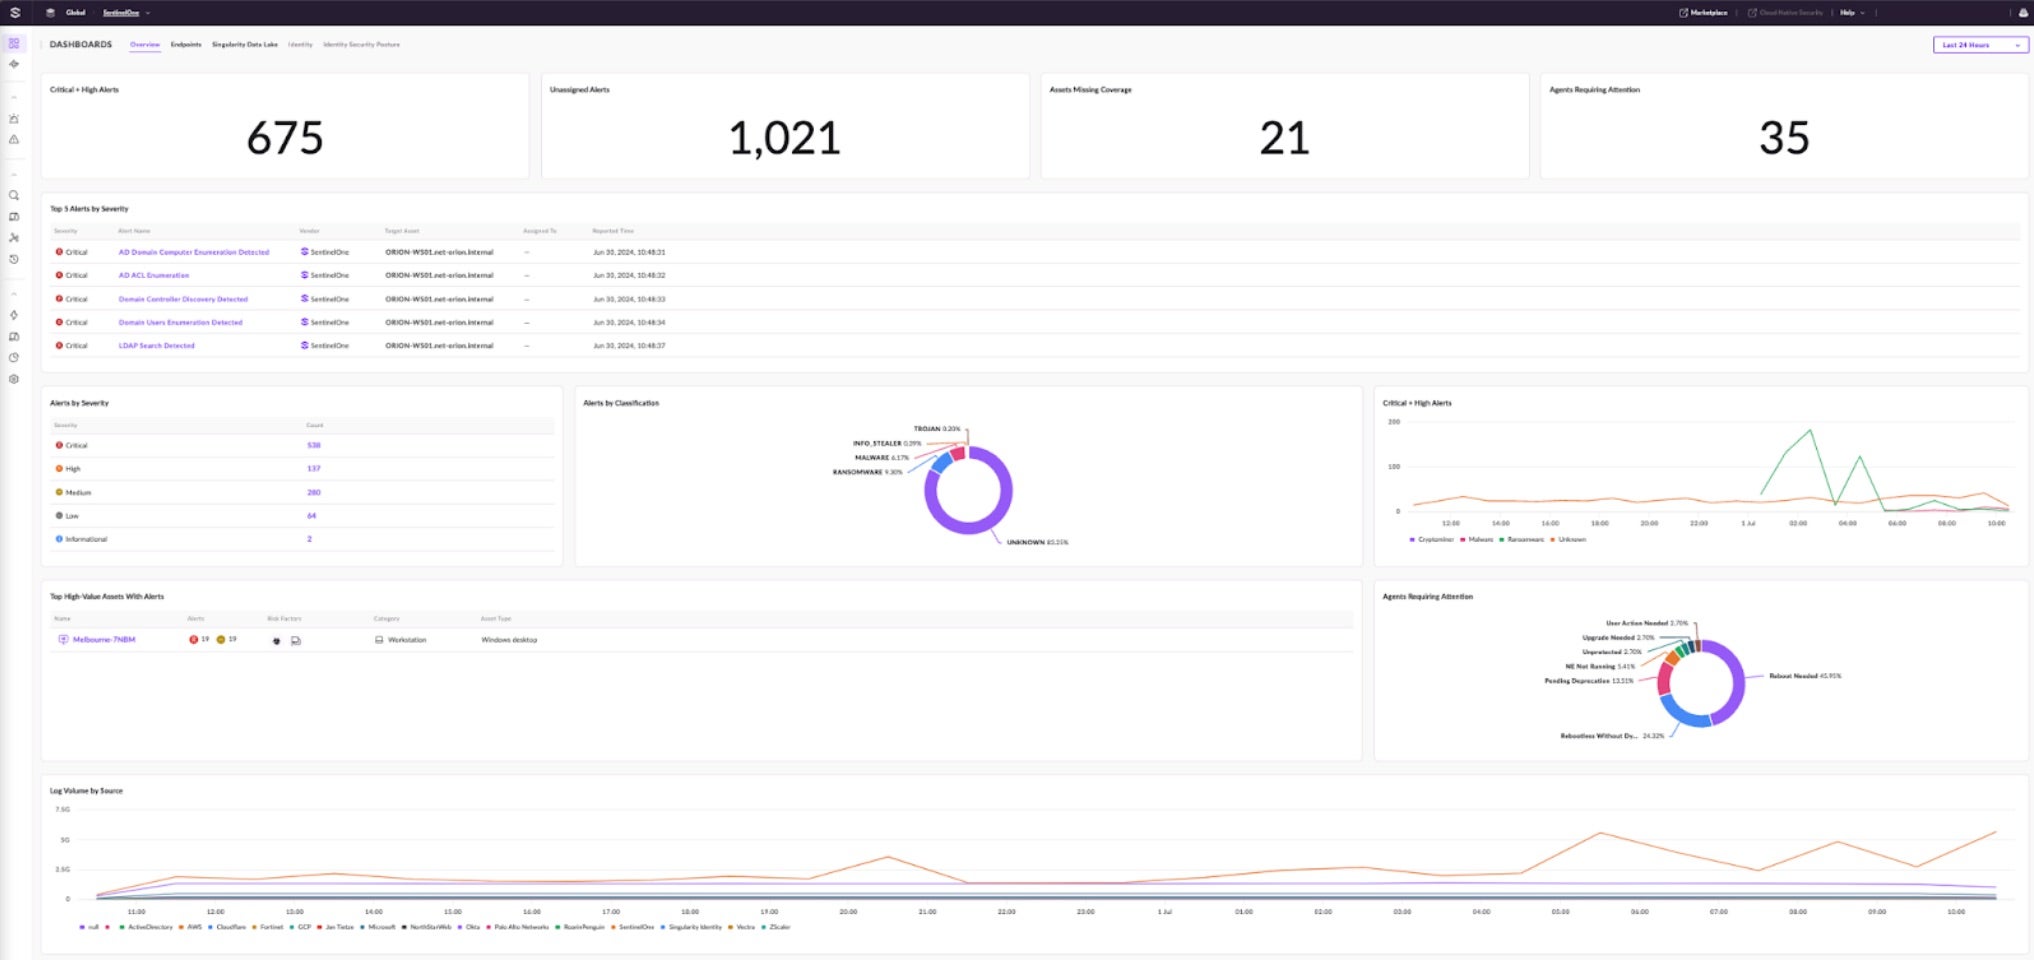
Let’s explore how to investigate a LockBit infection in the Singularity Operations Center. After logging into the console, the Overview Dashboard provides a broad view of security alerts and related assets. There are multiple open alerts, ten of which are of high or critical severity. From the numerous open alerts, this example will focus on the critical alerts.
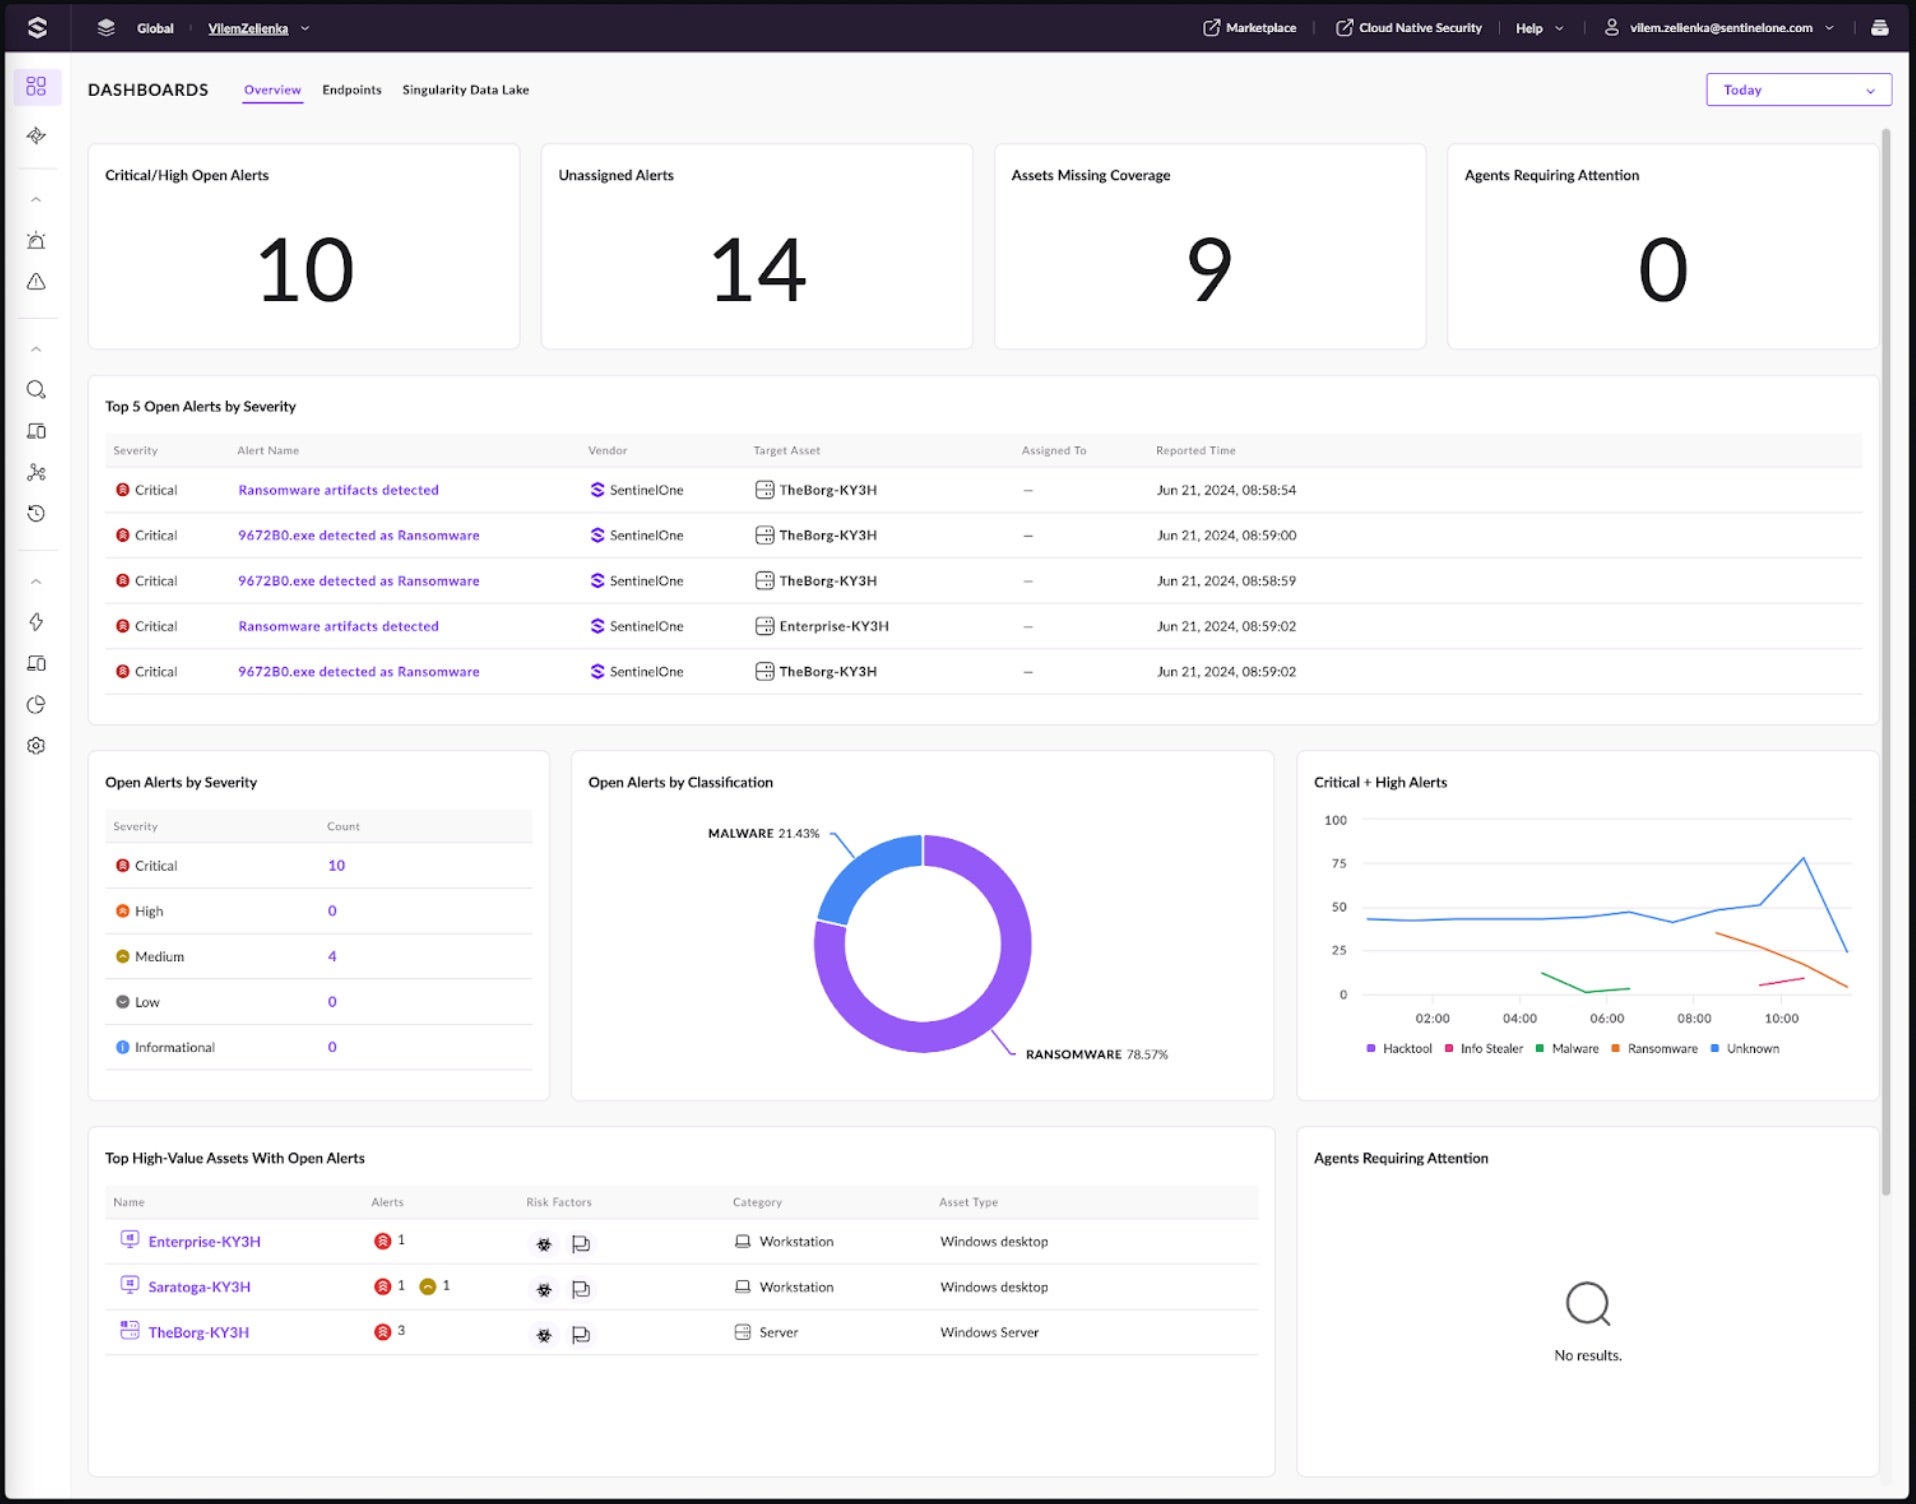
The drill-down creates a filter that allows analysts to quickly view new alerts with critical and high severity. To start the triage, these alerts will be assigned to an analyst. The Alert Status will be updated to “In Progress”.

Next, the alerts are grouped by File Hash and Asset Name to see the targeted assets and the extent of the infection. This is done by clicking on the “+ Add Column” button at the top of the page, where filters are available. Analysts can group by the available columns on the page to organize the information.
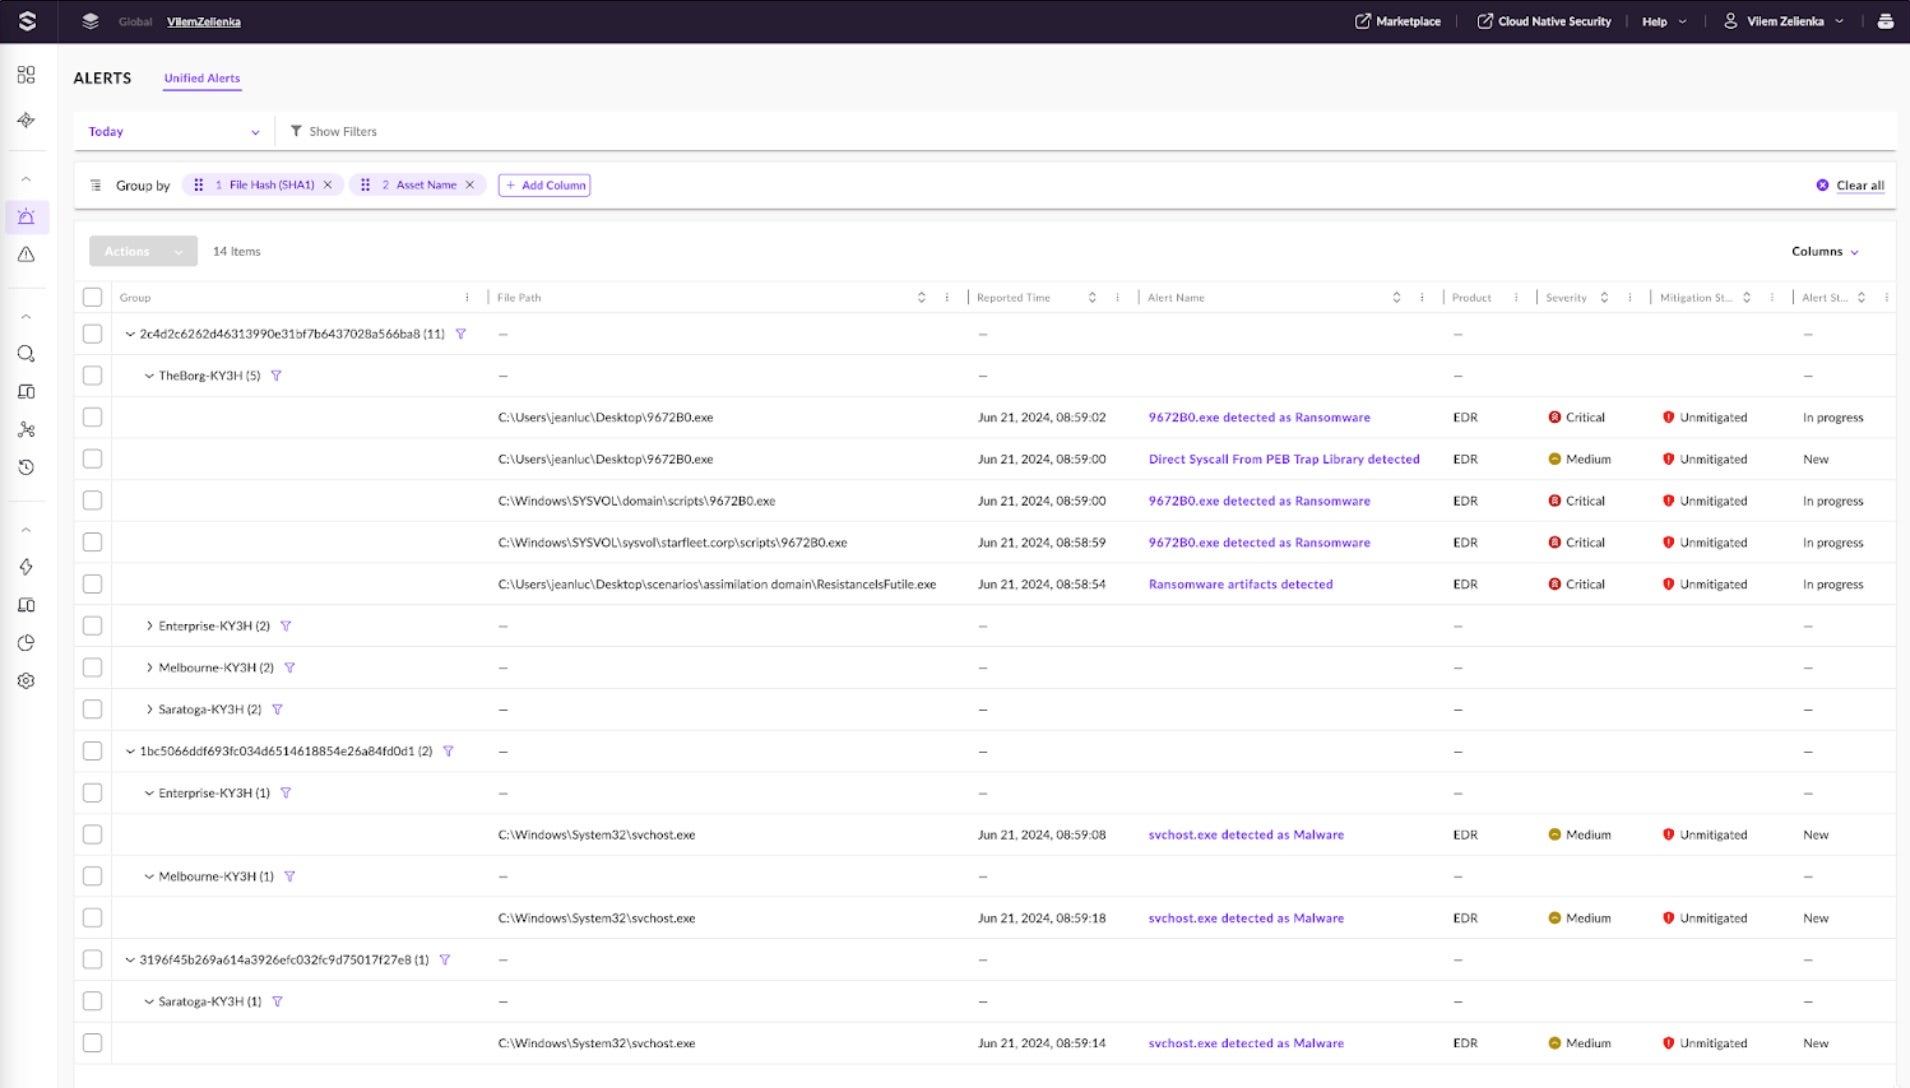
Once the alerts are grouped, it is clear that the critical alerts are related to one hash, and the lower severity alerts are related to svchost.exe. Let’s focus on the hash with critical alerts. The hash is detected on four different assets, indicating that the attacker or malware can laterally move through the network. The file name changes on subsequently infected devices.
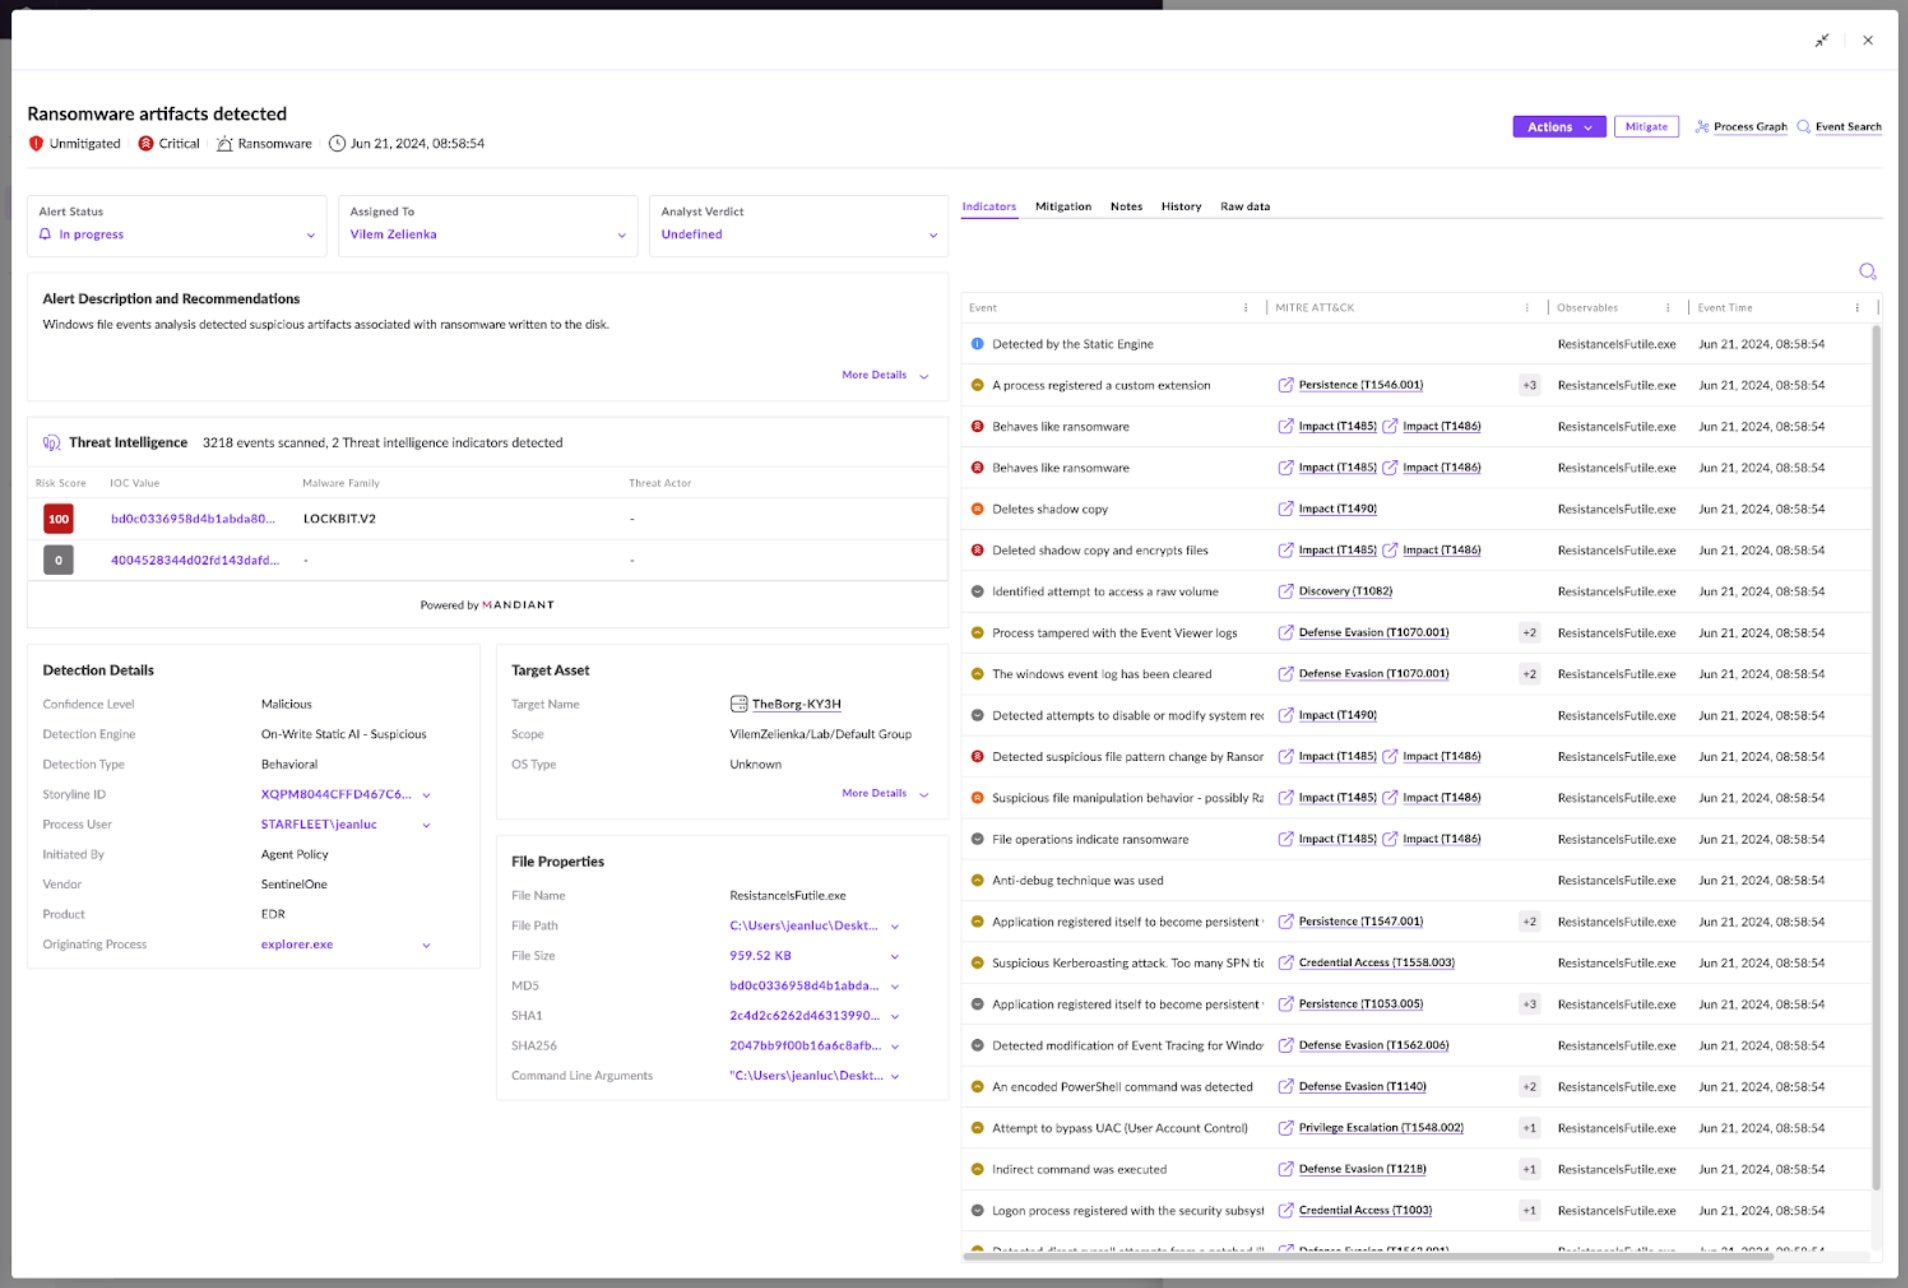
Let’s investigate the first occurrence of that hash on TheBorg machine in the “Ransomware artifacts detected” alert. The Alerts Details view provides more information about the threat. These details indicate that a Jeanluc user in the STARFLEET domain executed the process, which originated from explorer.exe, indicating that the user opened the file from the file system.
The Indicators tab provides more granular details, such as behavioral indicators. The severity icons specify that the most severe events are related to ransomware behavior, such as shadow copy deletion and file encryption. These behavioral indicators tell us a story of the malware’s behavior.
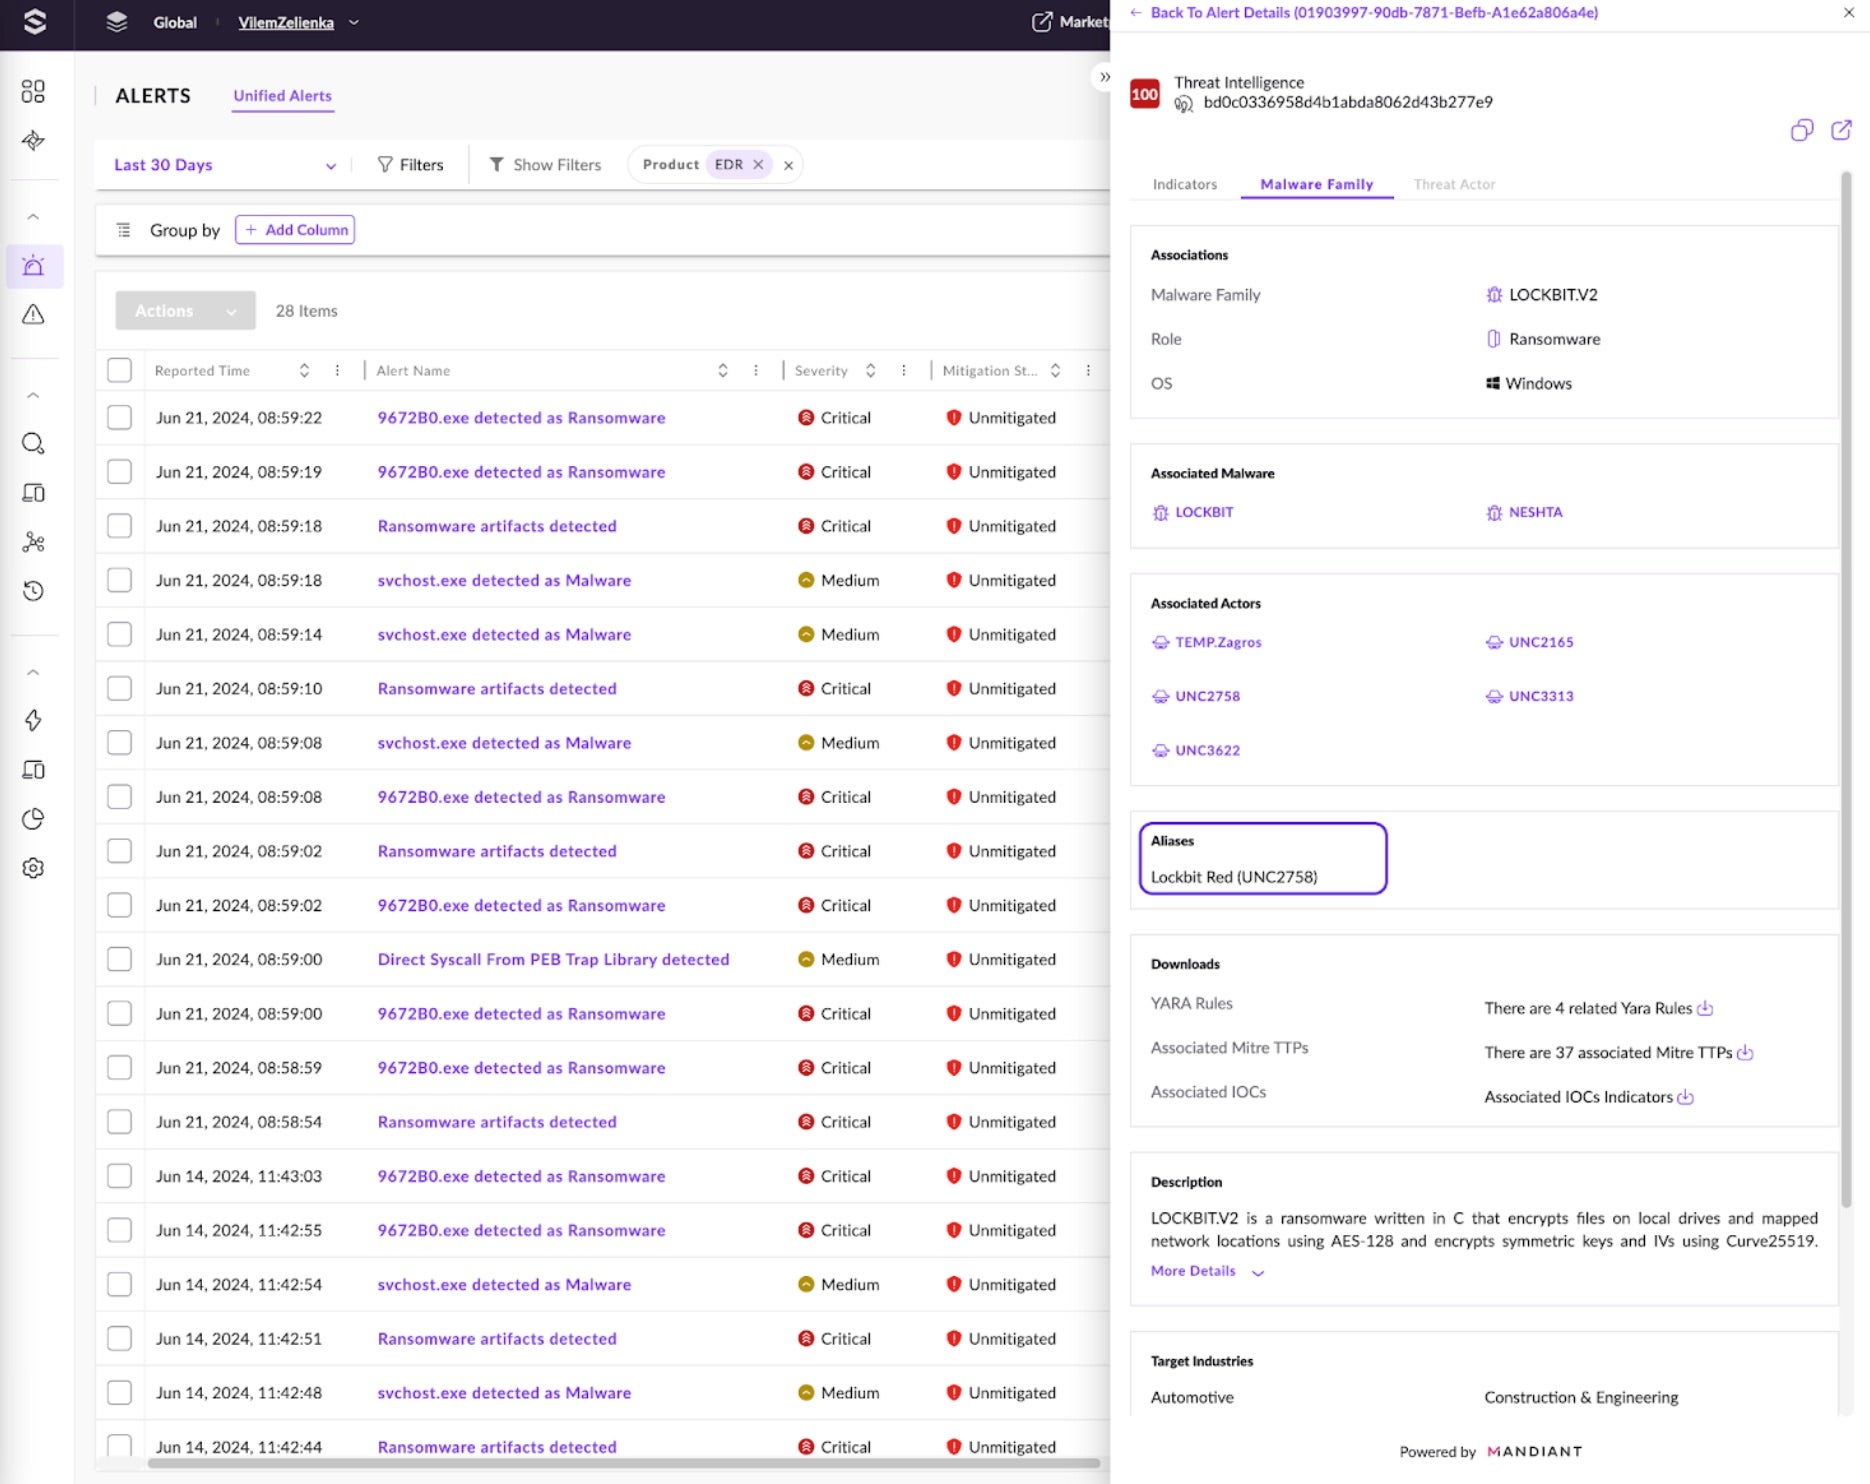
To validate the file’s maliciousness and gain confidence in mitigating the threat as a true positive, analysts can search for the file’s hash in the threat intelligence sources such as the Singularity Threat Intelligence solution or VirusTotal integration. In this instance, it is clear that Singularity Threat Intelligence attributes it to LOCKBIT.V2. Clicking through shows more known details about the threat powered by Mandiant. We can see that Mandiant is already tracking it as LockBit Red associated with UNC2758.
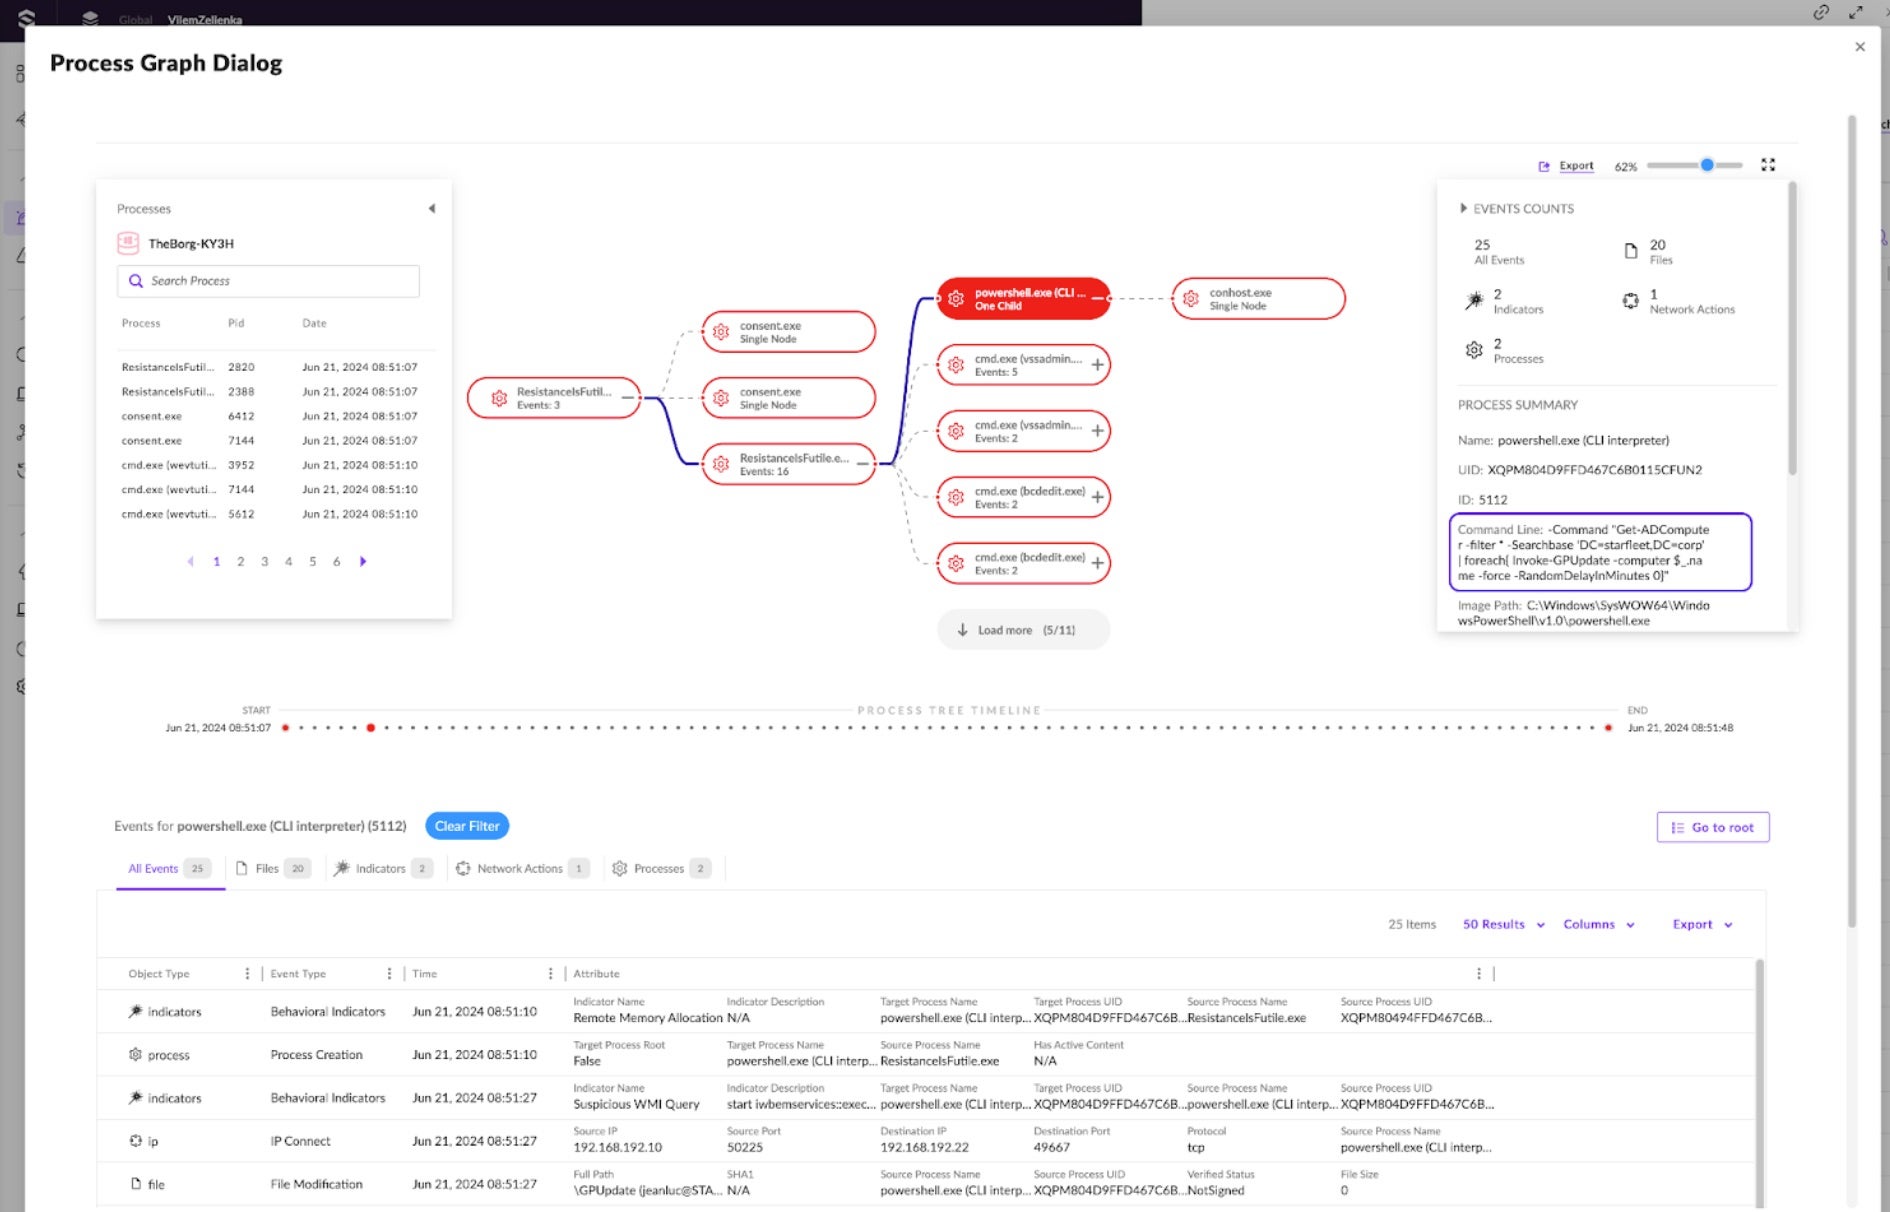
Let’s explore the Process Graph to visually inspect what happened. Here, the ResistanceIsFutile.exe process is running PowerShell and CMD commands. The PowerShell process in the “Command Line” attribute looks for all domain computers to prepare for lateral movement, adding a random delay between requests. Clicking through shows many of the actions indicated before as well as all the “IP Connect” events communicating with other assets.
The new Graph Explorer also illustrates the connections between alerts and assets. Let’s filter for all Assets with high or critical severity alerts. In this example, all assets have two critical alerts: Ransomware artifacts and the renamed malware 9672B0.exe. This confirms the correlation between the original alert and other alerts on all the servers and endpoints in the graph.
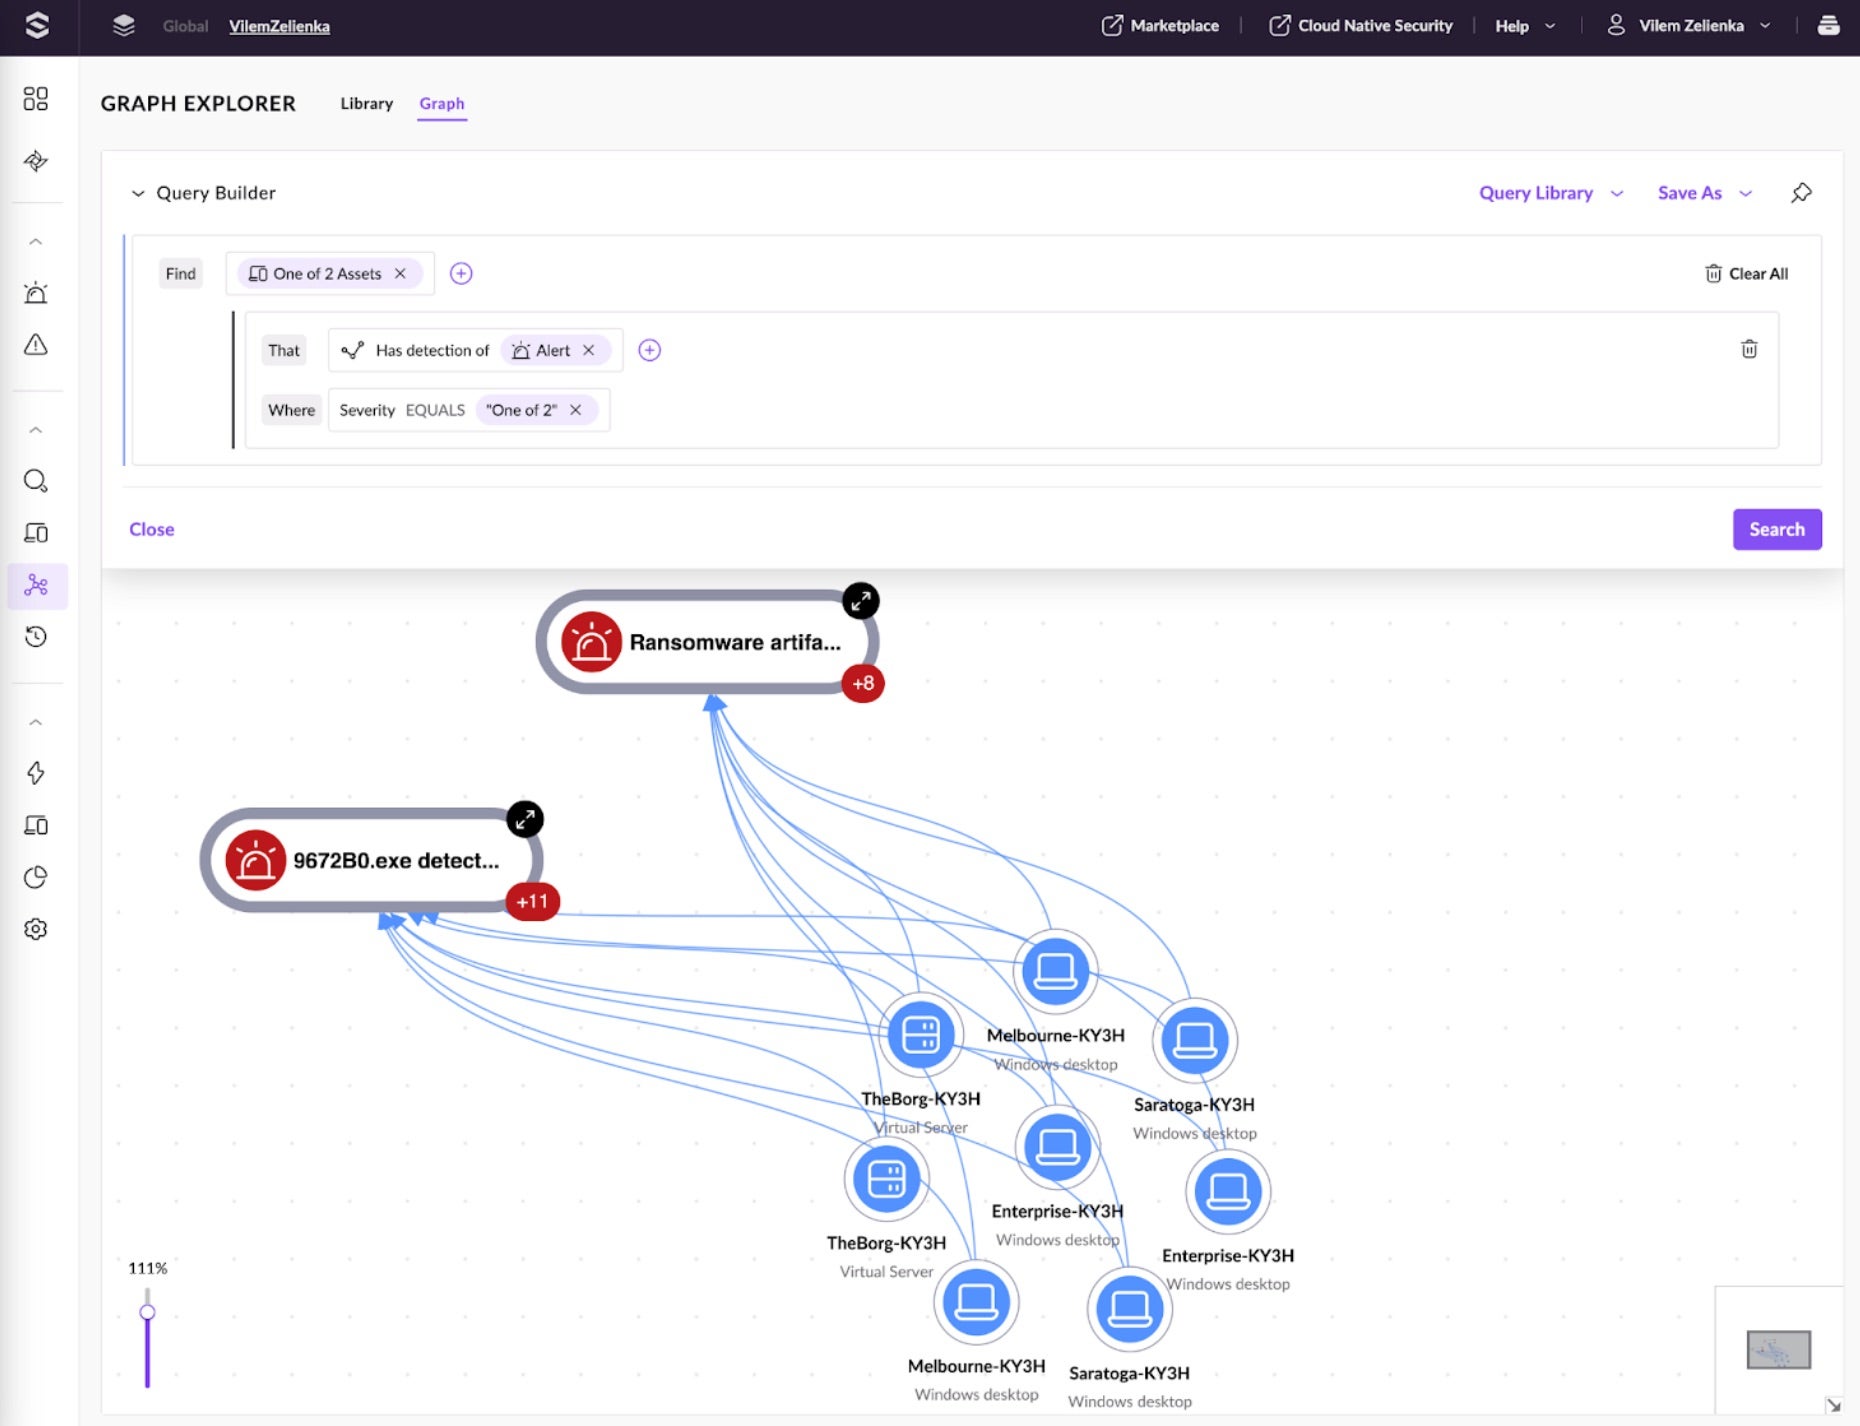
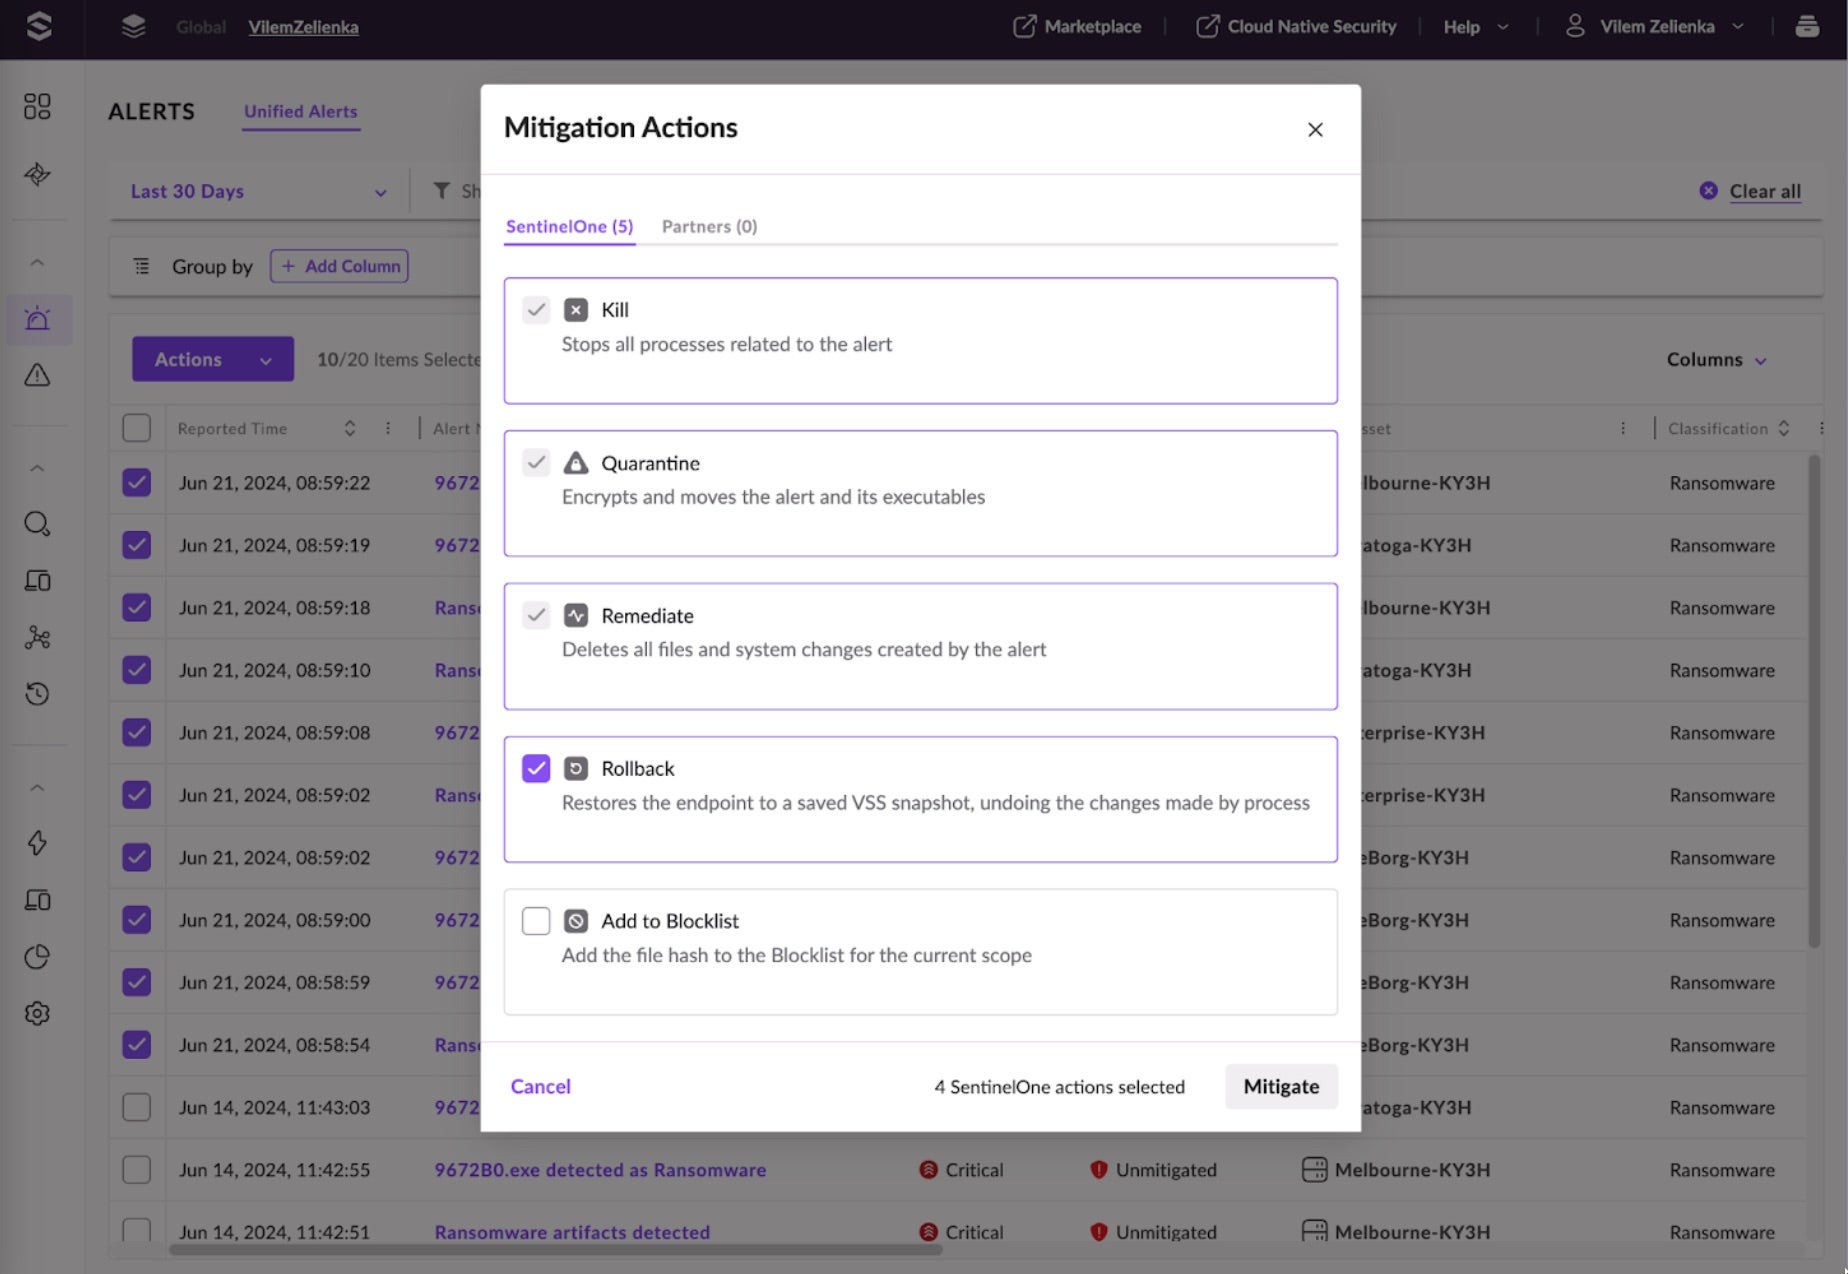
This information confidently confirms that a ransomware infection is replicating in the network. Analysts can now mitigate all the alerts before proceeding with further investigation. All actions we performed are visible in the History tab of the alert details, lessening the need for extensive notes of the investigation process.
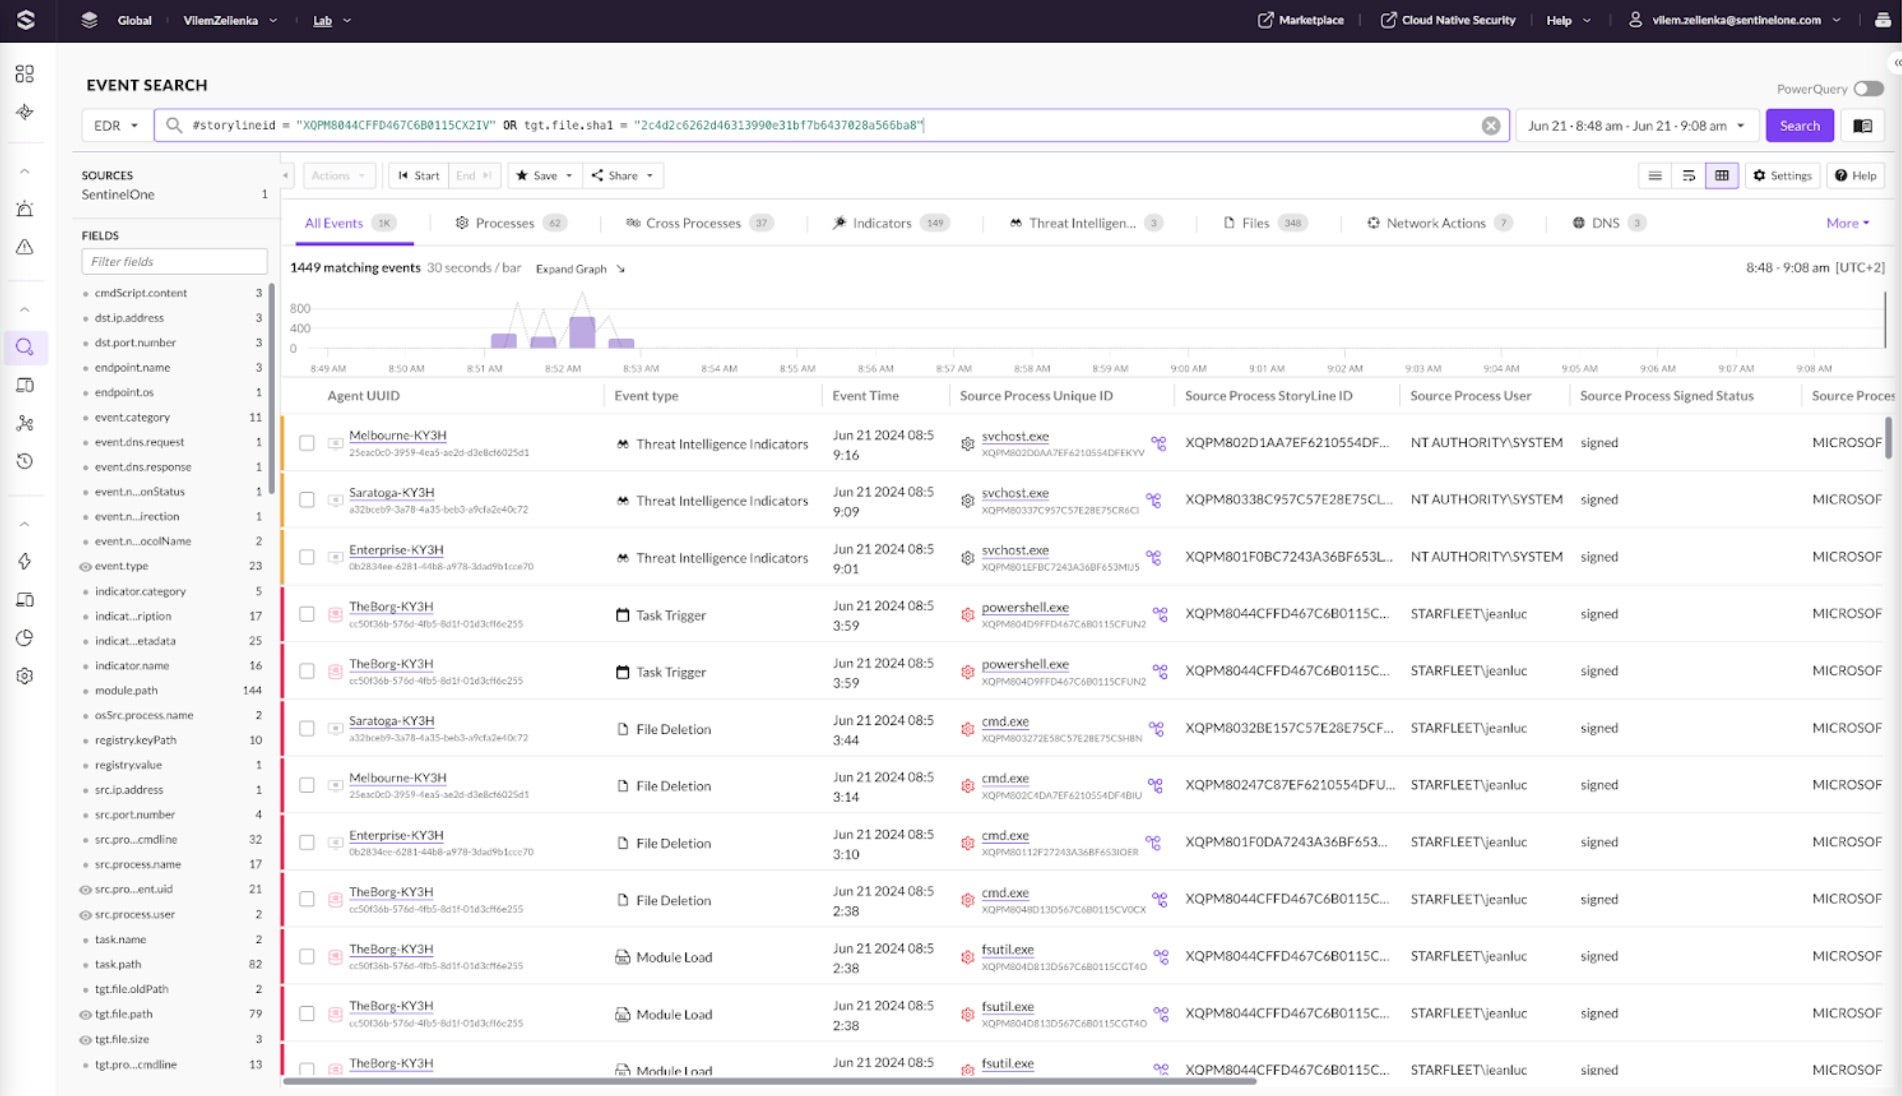
The next step is to hunt for indicators of compromise in Event Search and include them in the incident report. Drill down to Event Search from the Alert Details drawer and see all the events related to the alert’s Storyline. View different tabs for more specific event categories, such as DNS, Network Actions, or Scheduled Tasks.
Analysts can also write hunting PowerQueries to get more details and group events together. The following example lists all commands executed by the LockBit processes for each endpoint. This information can be used to write more hunting queries, see if similar behavior has been detected in the past, or write new detections for this behavior.
dataSource.name='SentinelOne' event.type='Process Creation' src.process.parent.name in ('ResistanceIsFutile.exe', '9672B0.exe')| let cmdline = format("%s %s", tgt.process.name, tgt.process.cmdline)| group count(), cmdlines=array_agg_distinct(cmdline) by endpoint.name, src.process.name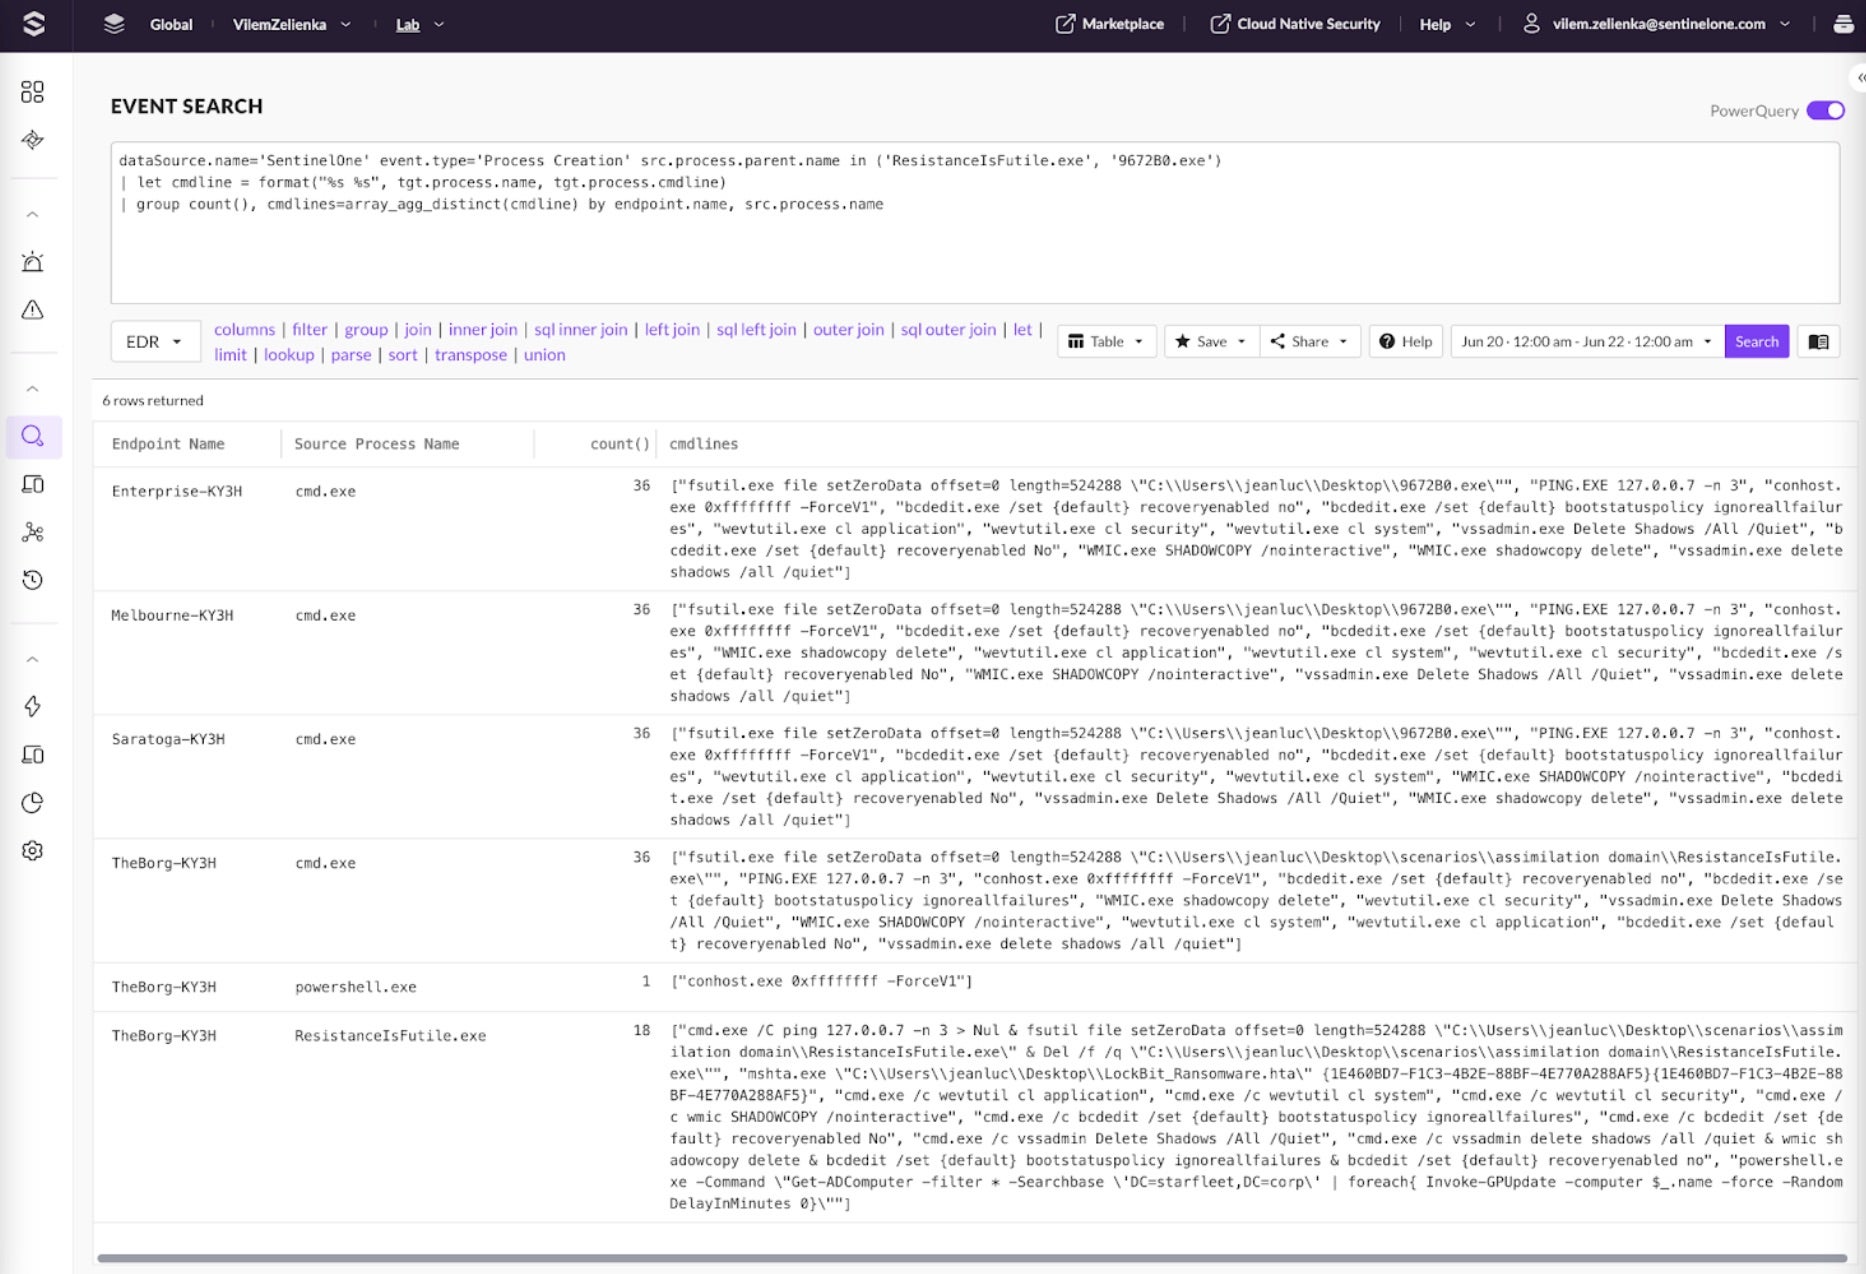
The following PowerQuery can be used to see the list of ports on which the initially compromised host communicated.
endpoint.name = 'TheBorg-KY3H' event.type='IP Connect' event.network.direction = 'OUTGOING' | group count=count(), dst.ports=array_agg_distinct(dst.port.number) by dst.ip.address| sort - dst.ports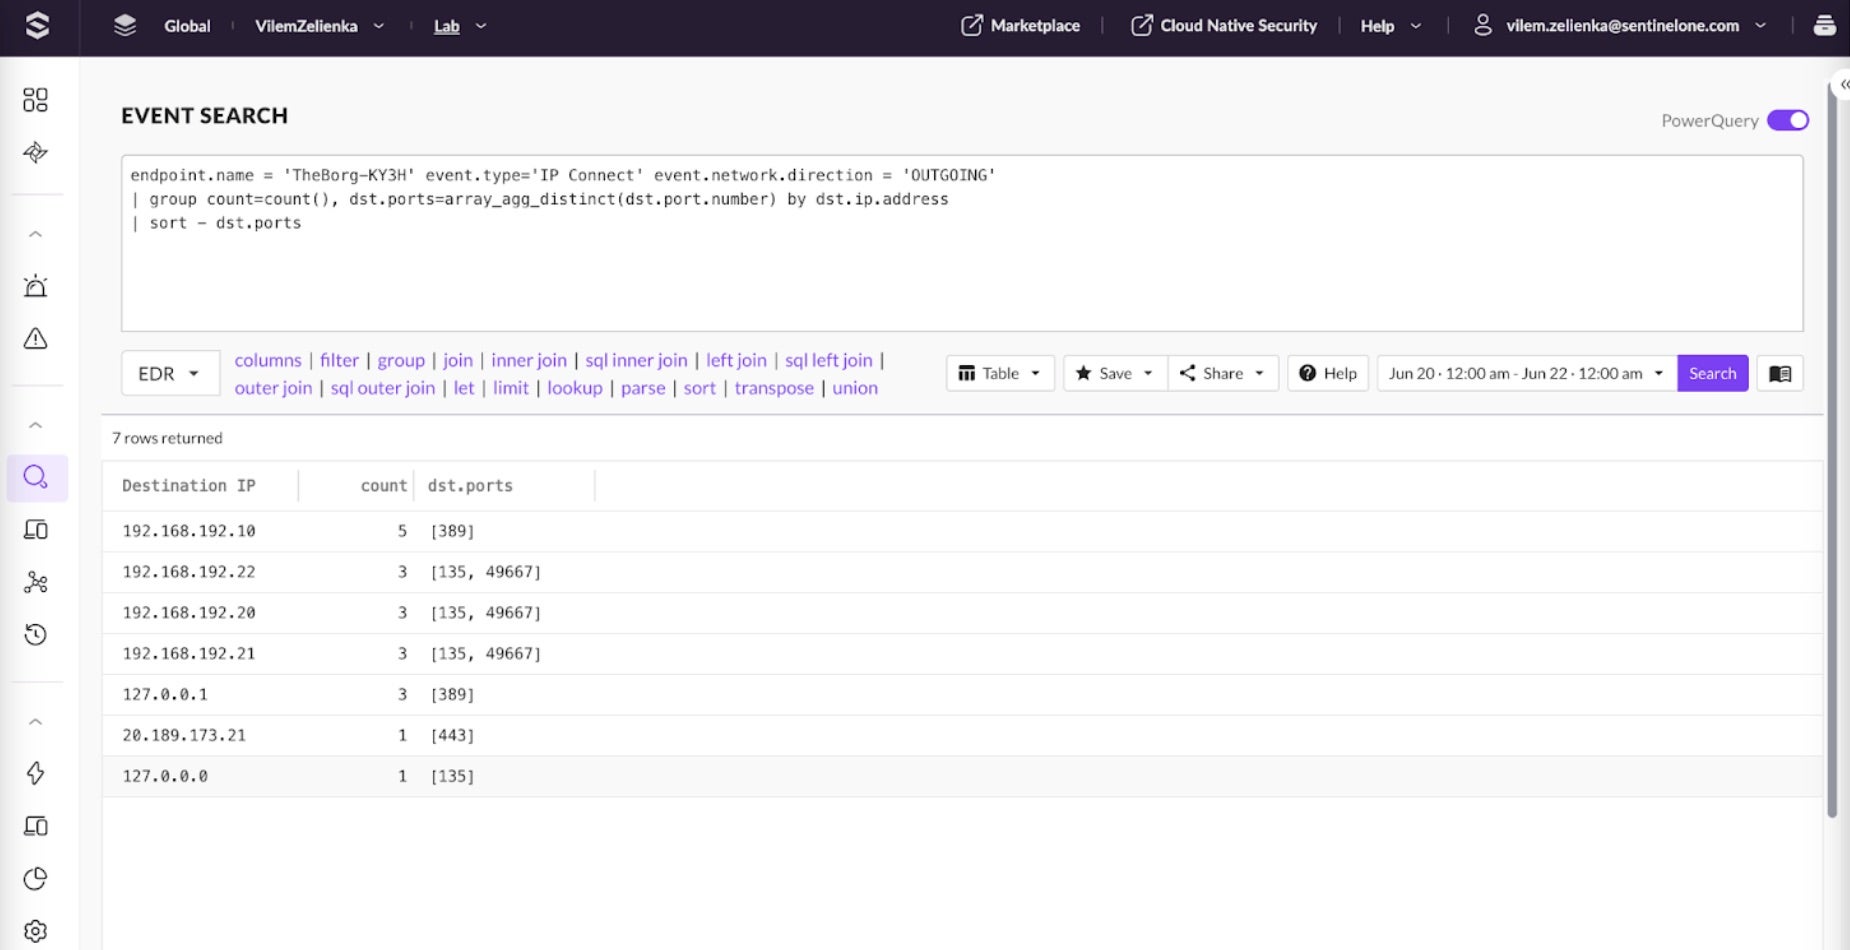
There are many other queries that can be leveraged to look for anomalies in the data. The most critical part of this process is carefully examining our events and distilling the malware’s unique behavior. The Search Library provides hunting queries to help kickstart this process.
Enable Operations Center Today for Faster Investigation
The Singularity Operations Center is Generally Available (GA) to all cloud-native customers. We invite you to explore the new console and experience how our innovative approach enhances and unifies security operations. Our Singularity Platform is designed to meet the evolving needs of modern SOCs, providing the flexibility and scalability required to handle the growing complexity of today’s threat landscape.
Learn More
Not a customer, but want to learn more? Meet our team for a demo to see how you can get started with the Singularity Platform, or visit our self-guided product tours.
 enables unfettered visibility, industry-leading detection, and autonomous response. Discover the power of AI-powered, enterprise-wide cybersecurity.
from SentinelOne https://ift.tt/31UDZF4
via IFTTT
No comments:
Post a Comment