Written by: Casey Charrier, Robert Weiner
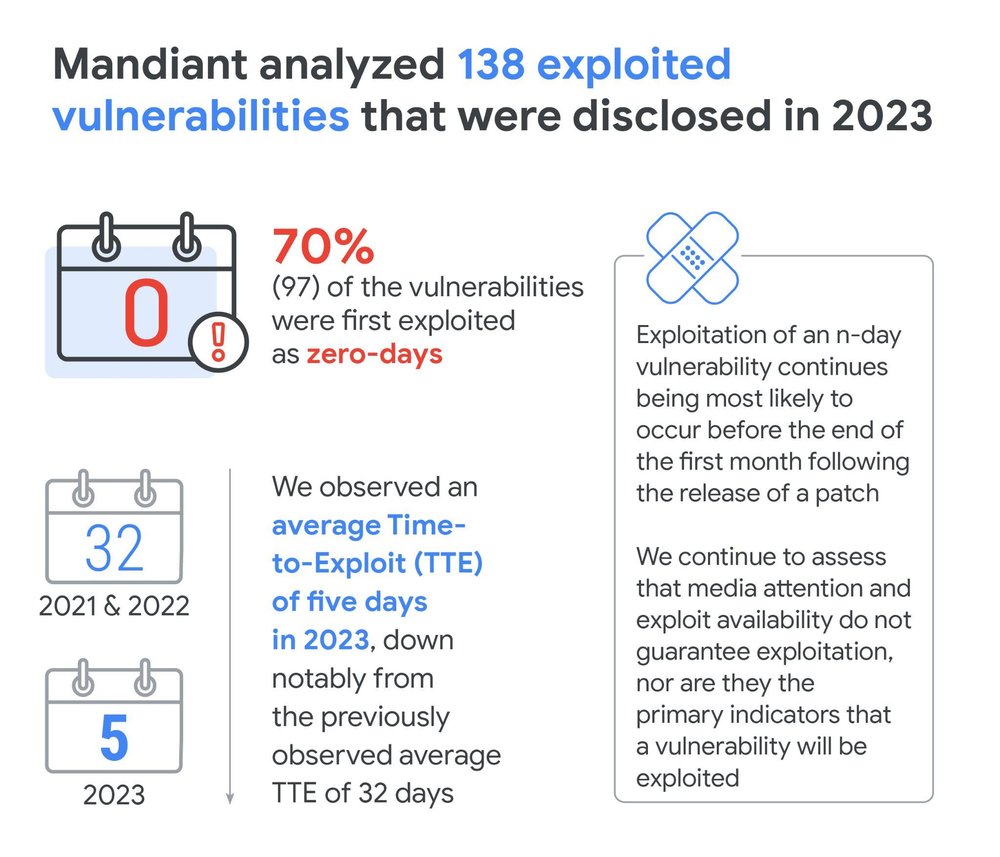
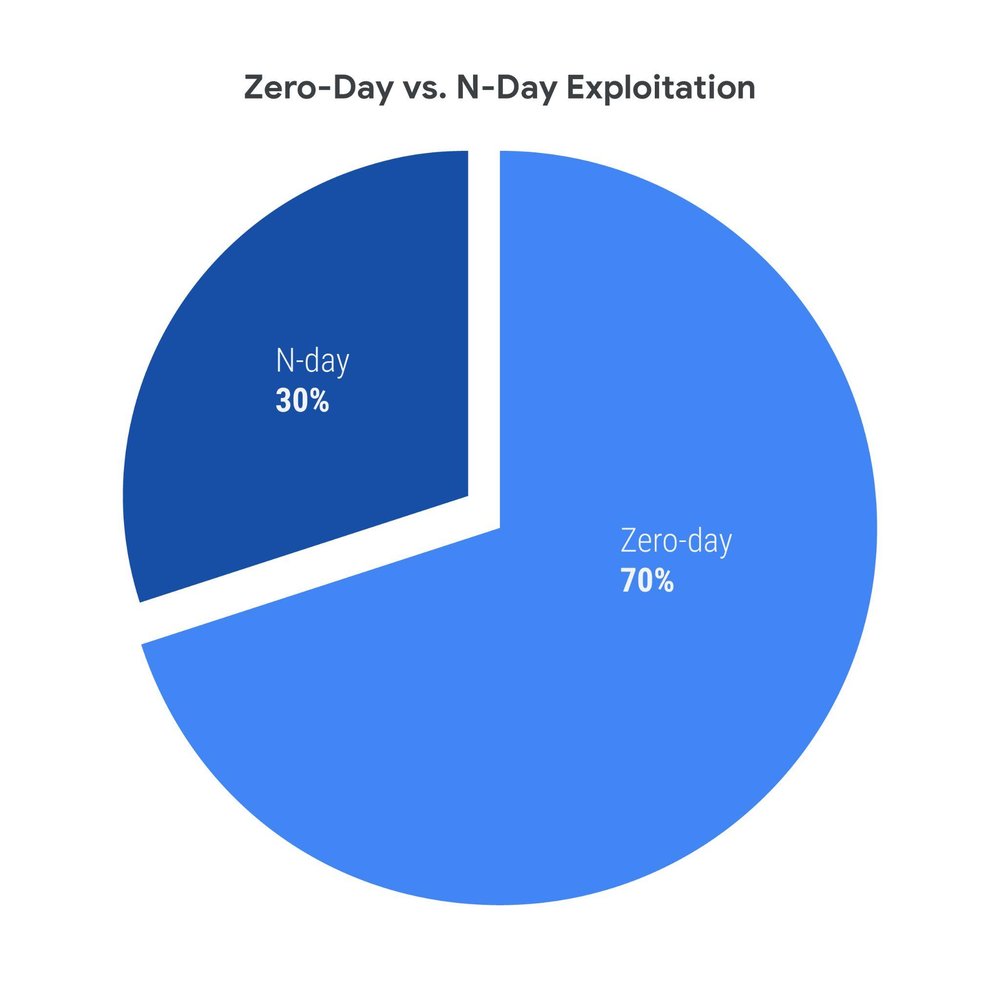
Mandiant analyzed 138 vulnerabilities that were disclosed in 2023 and that we tracked as exploited in the wild. Consistent with past analyses, the majority (97) of these vulnerabilities were exploited as zero-days (vulnerabilities exploited before patches are made available, excluding end-of-life technologies). Forty-one vulnerabilities were exploited as n-days (vulnerabilities first exploited after patches are available). While we have previously seen and continue to expect a growing use of zero-days over time, 2023 saw an even larger discrepancy grow between zero-day and n-day exploitation as zero-day exploitation outpaced n-day exploitation more heavily than we have previously observed.
While our data is based on reliable observations, we note that the numbers are conservative estimates as we rely on the first reported exploitation of a vulnerability. Frequently, first exploitation dates are not publicly disclosed or are given vague timeframes (e.g., "mid-July" or "Q2 2023"), in which case we assume the latest plausible date. It is also likely that undiscovered exploitation has occurred. Therefore, actual times to exploit are almost certainly earlier than this data suggests.
Exploitation Timelines
Time-to-Exploit
Time-to-exploit (TTE) is our metric for defining the average time taken to exploit a vulnerability before or after a patch is released. Historically, our analyses have seen reduced times-to-exploit year over year. Through 2018 to 2019, we observed an average TTE of 63 days. From 2020 to the start of 2021, that number decreased to 44 days. Then, across all of 2021 and 2022, the average observed TTE dropped further to 32 days, already half of our first tracked TTE starting in 2018. In 2023, we observed the largest drop in TTE thus far, with an average of just five days. This is less than a sixth of the previously observed TTE.
Our average TTE excludes 15 total data points, including two n-days and 13 zero-days, that we identified as outliers from a standard deviation-based statistical analysis. Without the removal of these outlier TTEs, the average grows from five to 47.
Zero-Day vs. N-day Exploitation
Prior to 2023, we had observed steady ratios of n-days to zero-days, being 38:62 across 2021–2022 and 39:61 across 2020 into part of 2021. However, in 2023, this ratio shifted to 30:70, a notable departure from what we had observed previously. Given that zero-day exploitation has risen steadily over the years, the shifting ratio appears to be influenced more from the recent increase in zero-day usage and detection rather than a drop in n-day usage. It is also possible that actors had a larger number of successful attempts to exploit zero-days in 2023. Future data and analyses will show whether this is the start of a noticeable shift, or if 2023 is a one-off in this regard.
N-Day Exploitation
Consistent with our last analysis, we found that exploitation was most likely to occur within the first month of a patch being made available for an already disclosed vulnerability. Twelve percent (5) of n-days were exploited within one day, 29% (12) were exploited within one week, and over half (56%) were exploited within one month. In our last report, 25% of the n-day vulnerabilities were exploited after the six-month mark. In 2023, all but two (5%) n-days were exploited within six months.

Disclosure to Exploit to Exploitation Timelines
Of the analyzed vulnerabilities, 41 (30%) were first exploited after the vulnerability's public disclosure. This section will focus on this subset of vulnerabilities. While we have pursued analysis of associations between exploit availability and exploitation timelines, Mandiant has continued not to observe a correlation between the two. It may be common to assume a relationship between the two data points; however, our longer-term analysis shows a distinct lack of association.
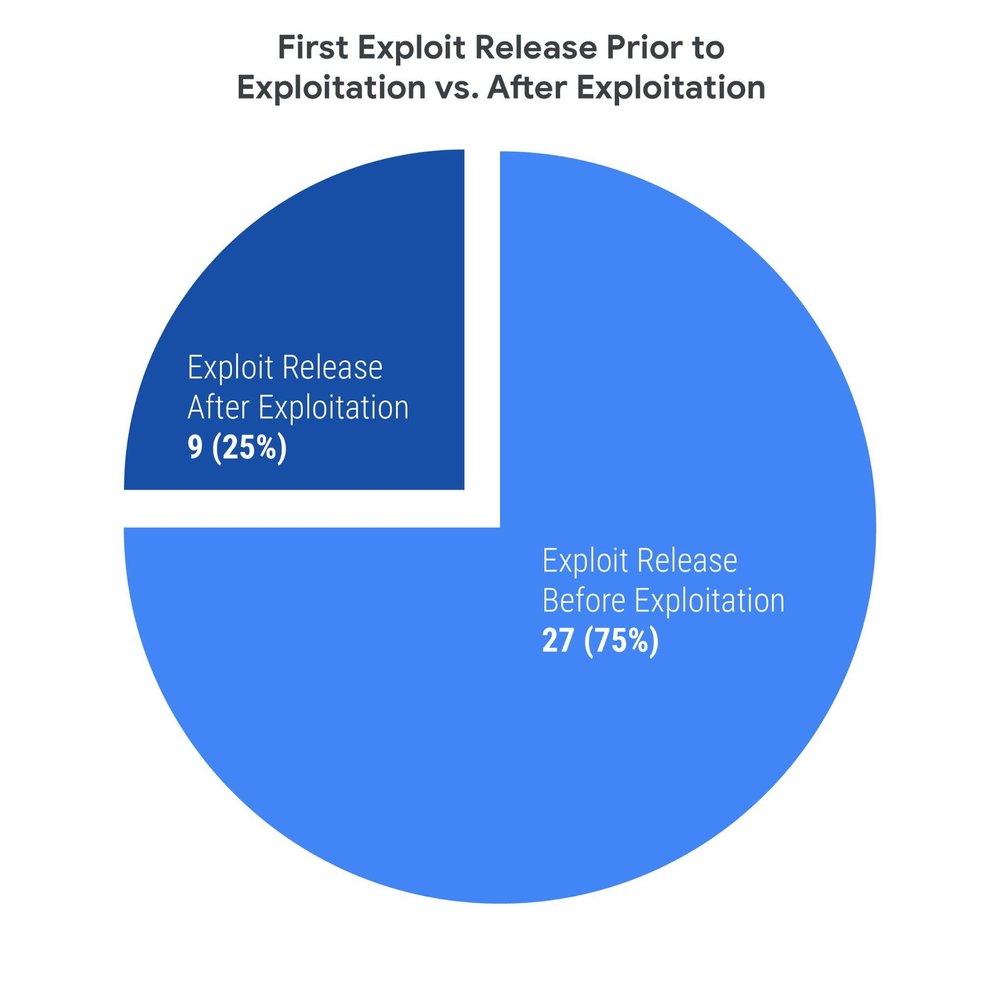
For vulnerabilities with exploits available prior to exploitation, we observed a median of 7 days from the date of disclosure (DoD) to the first public exploit release, and a median of 30 days from the exploit's release date to the date of first known exploitation. The median time from disclosure to exploitation of these vulnerabilities was 43 days.
For vulnerabilities with exploits first made available after exploitation, we observed a median time of 15 days from disclosure to exploitation. The median time from exploitation to a publicly available exploit was observed to be four days, with a median timeline from disclosure to exploit release being observed as 23 days.
These statistics are consistent with our past analyses, which have expressed non-deterministic outcomes regarding the influence of existing exploits on in-the-wild exploitation. We continue to find this true while also noting that there are other factors that affect the exploitation timeline of a given vulnerability. Potential factors include, but are not limited to, exploitation value and exploitation difficulty. To highlight one of these factors, we note that of the vulnerabilities disclosed in 2023 that received media coverage, 58% are not known to be exploited in the wild, and for those with at least one public proof of concept (PoC) or exploit, 72% are not known to be exploited in the wild. The following are two specific examples we observed that demonstrate the variance in how much of an effect an exploit's release can have on the time to in-the-wild exploitation, and that illustrate other potential influences in exploitation.
CVE-2023-28121 Use Case
CVE-2023-28121 is an improper authentication vulnerability affecting the WooCommerce Payments plugin for WordPress. This vulnerability was disclosed on March 23, 2023, and did not receive its first proof of concept or even technical details until three and a half months later on July 3, when a blog was posted outlining how to create an Administrator user without prior authentication. This was followed quickly by a Metasploit module being released on July 4 with the ability to scan for the vulnerability and exploit it to create a new Administrator user. No exploitation activity was seen immediately following the release of this PoC or Metasploit module. Instead, exploitation activity is first known to have begun on July 14, soon after another weaponized exploit was released. This exploit was first released July 11, with an upgraded version then released on July 13. Both versions of this exploit have the capability to exploit an arbitrary number of vulnerable systems in order to create a new Administrator user. Wordfence later reported that the exploitation campaign began on July 14 and activity peaked on July 16 with 1.3 million attacks observed on that day alone.
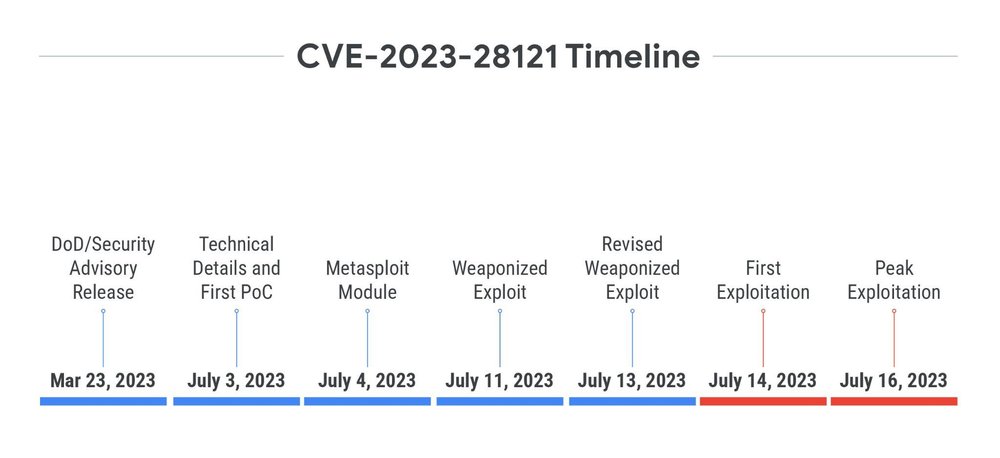
This vulnerability's timeline highlights a period of over three months where exploitation did not occur following disclosure; however, large-scale exploitation began 10 days after the first exploit was released and only three days after a second exploit with mass-exploitation capabilities was released. In this case, we can see that there is likely an increased motivation for a threat actor to exploit this vulnerability due to a functional, large-scale, and reliable exploit being made publicly available.
CVE-2023-27997 Use Case
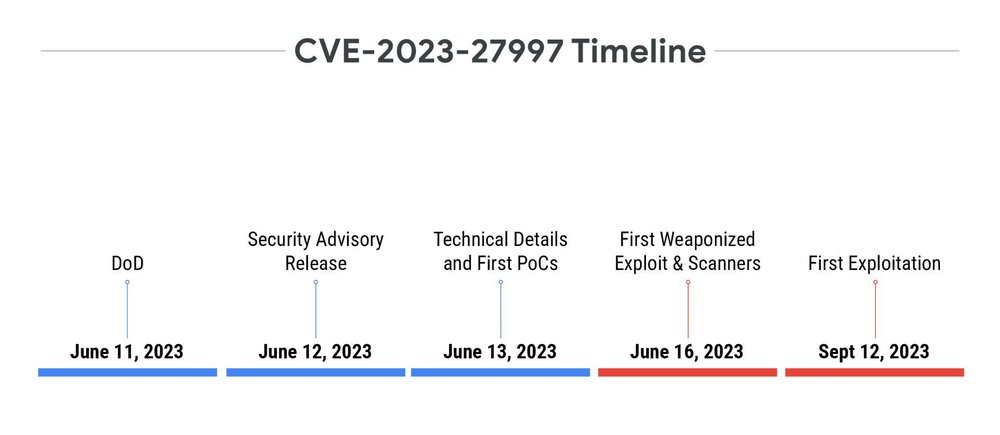
CVE-2023-27997, also known as XORtigate, is a heap-based buffer overflow in the Secure Sockets Layer (SSL) / virtual private network (VPN) component of Fortinet FortiOS. This vulnerability was disclosed on June 11, 2023, and immediately received significant media attention, being named XORtigate prior to Fortinet even releasing their official security advisory on June 12. The disclosure was quickly followed on June 13 with two blog posts containing PoCs, and one since-deleted non-weaponized exploit on GitHub. By June 16, proof-of-concept code, scanners, and weaponized exploit code were all publicly available. While exploitation could be expected to swiftly follow the immediate attention and exploits released, it was not until around four months after disclosure, on Sept. 12, that Mandiant first observed exploitation activity. Exploitation of this vulnerability is only known by Mandiant to be performed in relatively limited and targeted campaigns. In this case, we see that public interest and exploit availability did not appear to impact the timeline of exploitation.
Use Case Comparison
One of the most likely reasons for the difference in observed timelines we see here is the difference in the reliability and ease of exploitation between the two vulnerabilities. CVE-2023-28121, which was exploited soon after exploits became available, is quite simple to exploit, requiring just one specific HTTP header to be set on an otherwise normally formatted web request. This makes large-scale and automated exploitation campaigns more plausible. On the other hand, CVE-2023-27997 requires exploiting a heap-based buffer overflow against systems which typically have several standard and non-standard protections, including data execution prevention (DEP) and address space layout randomization (ASLR), as well as navigating the logic of a custom hashing and XORing mechanism. When considering the multiple complexities involved in addition to the fact that targeted systems would likely already have multiple mitigations in place, we can see how much less time-efficient and reliable exploitation of this vulnerability would be.
The other potential factor we identified is the difference in the value provided to an attacker by exploiting the affected products. FortiOS is a security-focused product that is typically deployed, oftentimes with significant privileges, within highly sensitive environments. Therefore, exploitation of CVE-2023-27997 could provide an attacker with those same privileges, furthering the potential damage an attacker could cause. WooCommerce Payments is one of the most popular WordPress plugins, and exploitation of CVE-2023-28121 can lead to complete access of the underlying web server that the plugin is running on. However, these web servers typically exist within demilitarized zones (DMZs) or other low-privileged network segments and thus present limited value to an attacker looking to exploit the larger organization that the plugin runs within. This suggests that intended utilization is a driving consideration for an adversary. Directing more energy toward exploit development of the more difficult, yet "more valuable" vulnerability would be logical if it better aligns with their objectives, whereas the easier-to-exploit and "less valuable" vulnerability may present more value to more opportunistic adversaries.
Exploited Vulnerabilities by Vendor
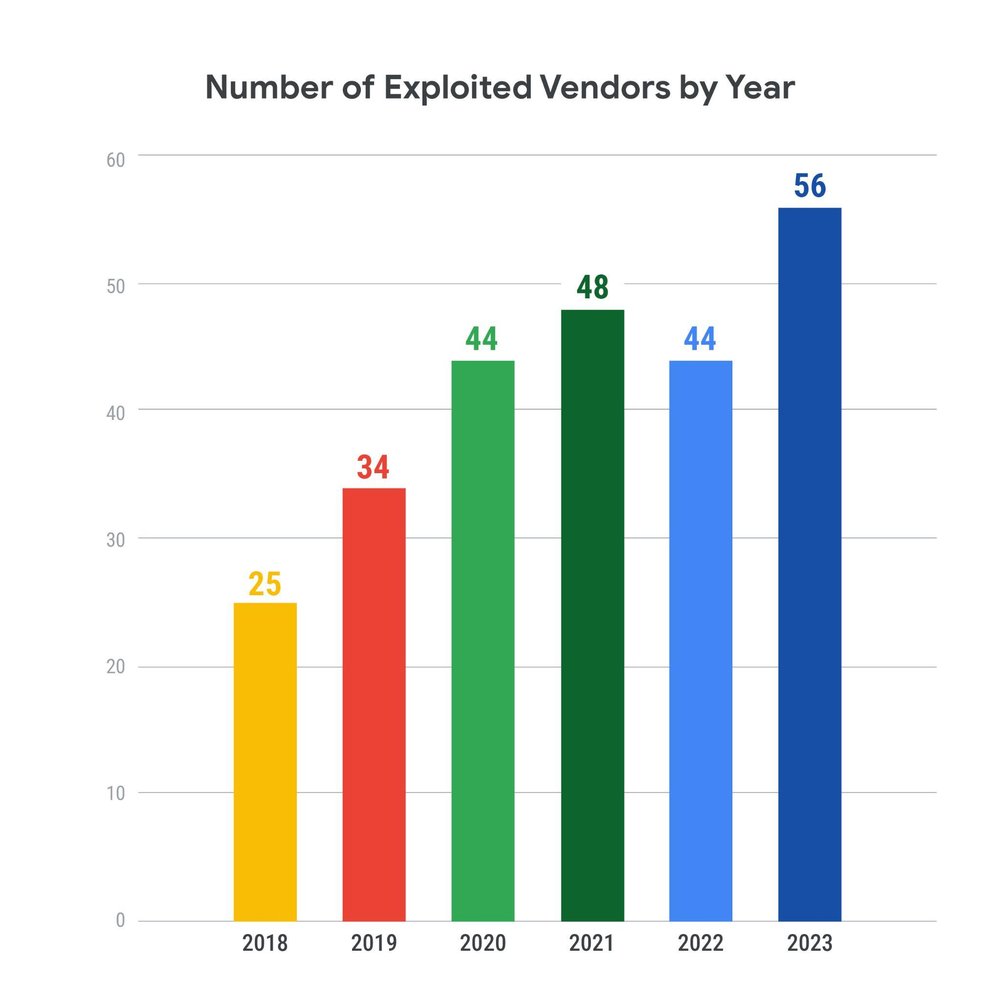
Exploited vendors continue to grow in both number and variety. In 2023, we saw a 17% increase from our previous highest exploited vendor count in 2021. In recent years, Microsoft, Apple, and Google have been the most exploited vendors year over year. However, their prominence in the overall number of exploited vendors has continued to decrease, falling just below 40% this past year. This is about a 10% drop from the just under 50% we saw from 2021 to 2022. Additionally, this is one of the first times in a while that one of the three has barely made a top spot. Google had eight vulnerabilities exploited, while Adobe, the fourth most exploited vendor, had six vulnerabilities exploited. Further, 31 of the 53 vendors (58%) had only one vulnerability exploited. Attackers are diversifying their targets and seeing success in doing so. As variance in targeted products continues to grow along with exploitation frequency, defenders must meet the challenge of protecting sprawling attack surfaces.
We note that the total number of vulnerabilities affecting a vendor does not directly relate to how secure or insecure a vendor's security posture is, nor does it signify that it is "less secure" than its competitors. Ubiquity of product use and the extent of a vendor's offered products both impact the numbers we see. Given the extent of today's challenges around defending such diversified systems and networks, learning from best practices across industries will lead to some of the best approaches for seeing successful exploitation prevention.
Implications
As the amount of discovered vulnerabilities grows over time, threat actors are provided with more opportunities to take advantage of these weaknesses. Mandiant has found that exploits, for both zero-days and n-days, have been the number one initial infection vector in Mandiant Incident Response (IR) engagements for 2020, 2021, 2022, and 2023. This is pushing defenders to provide efficient detection and response as well as to adapt to events in real time. Further, patching prioritization is increasingly difficult as n-days are exploited more quickly and in a greater variety of products. This increase in available technologies expands attack surfaces, reinforcing the importance of considering how a singular vulnerable technology could affect systems and networks laterally. Segmented architectures and access control implementations should be prioritized in order to limit the extent of impacted systems and data when exploitation does occur.
After multiple years of tracking our observed TTEs, we can see that the numbers fall drastically with each analysis. Just five to six years ago, we observed an average TTE of 63 days. That number has now fallen to five days. While we are aware that better and more common threat detection capabilities are likely an aspect of growing exploitation numbers, our data clearly shows that attackers are able to move quickly enough to beat patching cycles. As threat actors shorten TTEs and have more success with zero-day exploitation, delaying patching and exposing insufficiently protected attack surfaces heightens the chance of successful attacks.
Our data has continued to show that exploit release and media attention are not predictive of exploitation timelines. While in some cases these data points are correlated, the trends do not currently show that these factors should dictate prioritization or constitute an elevated response to a given vulnerability. Exploit release and the attention received by a vulnerability should be taken into account; however, they should be considered heuristic data points alongside other factors such as the difficulty of exploitation and the value exploitation may present.
Outlook
Based on our analyses, we know that zero-day exploitation remains a coveted approach for threat actors. If zero-day exploitation continues to outnumber n-day exploitation while n-day exploitation continues to occur more quickly following disclosure, we could expect the average TTE to fall further in the future. Additionally, because zero-day discovery is more difficult, there is room for growing numbers of exploited vulnerabilities over time as detection tools continue improving and become more widespread.
We do not expect n-day usage to drop significantly, nor for the number of targeted vendors to decrease over the coming years. We expect threat actors to continue using both n-days and zero-days as well as to expand exploitation across more vendors and products. Trends are expected to likely follow quicker exploitation timelines across a larger span of targets.
It is important to note that the increased ratio of zero-day exploitation and the generally shrinking timelines do not imply that threat actors will stop targeting n-days. We have seen, many times over, how threat actors will utilize vulnerabilities months or years after patches have been released.
from Threat Intelligence https://ift.tt/Y7wNVkL
via IFTTT
No comments:
Post a Comment